04 of December of 2024
Dimensions vs Metrics in Looker Studio | Best Practices & Templates

Isaac Correa
Google Analytics
Looker Studio Templates

Learn the key differences between dimensions and metrics in Looker Studio. Explore best practices, examples, and the top Looker Studio templates for impactful dashboards.
Dimensions vs. Metrics in Looker Studio: Understanding the Basics
When building dashboards in Looker Studio, two core concepts—dimensions and metrics—form the backbone of every report. Whether you’re using Looker Studio templates for e-commerce or creating a custom visualization, understanding the difference between these two elements ensures your data tells the right story. Here’s everything you need to know to master these essential building blocks.
What Are Dimensions?
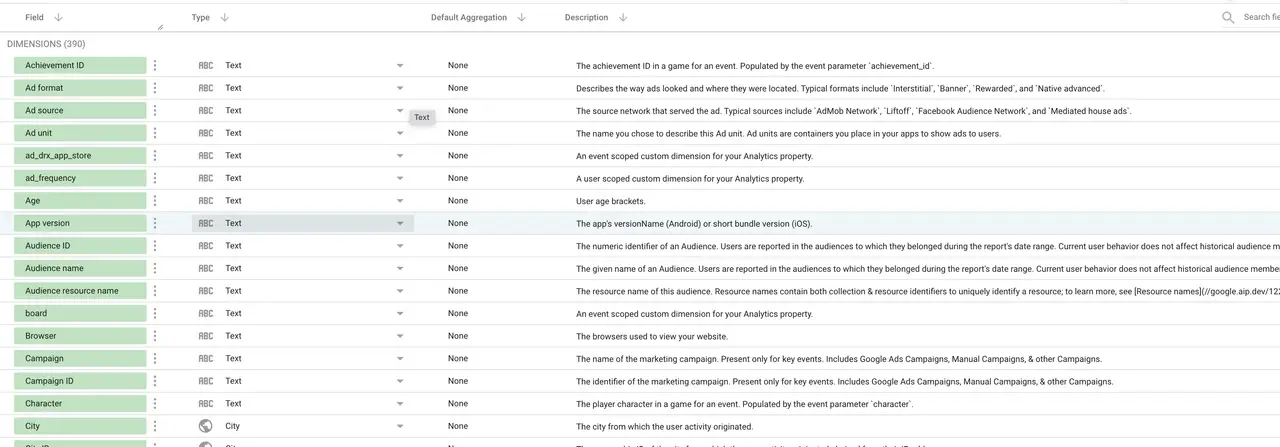
Dimensions provide context by categorizing and organizing your data. They describe the who, what, or where of your data and always consist of text or date-based values.
Characteristics of Dimensions:
- Qualitative data: Dimensions are never numerical.
- They answer questions like who, what, or where.
- They’re essential for grouping or filtering your metrics.
Examples of Dimensions:
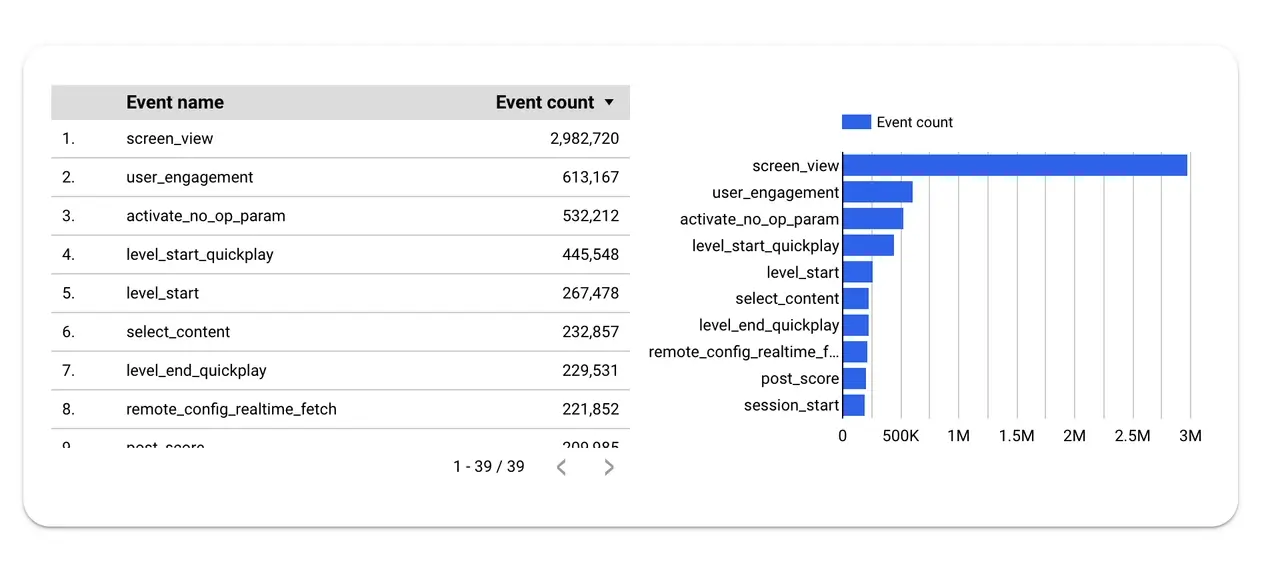
- Text-based Dimensions: Campaign Name, Product Category, Traffic Source.
- Date-based Dimensions: Transaction Date, Month, Year.
Example:
In an e-commerce dashboard built with a GA4 Looker Studio template, "Region" acts as a dimension that categorizes sales into geographical areas like North America, Europe, or Asia.
What Are Metrics?
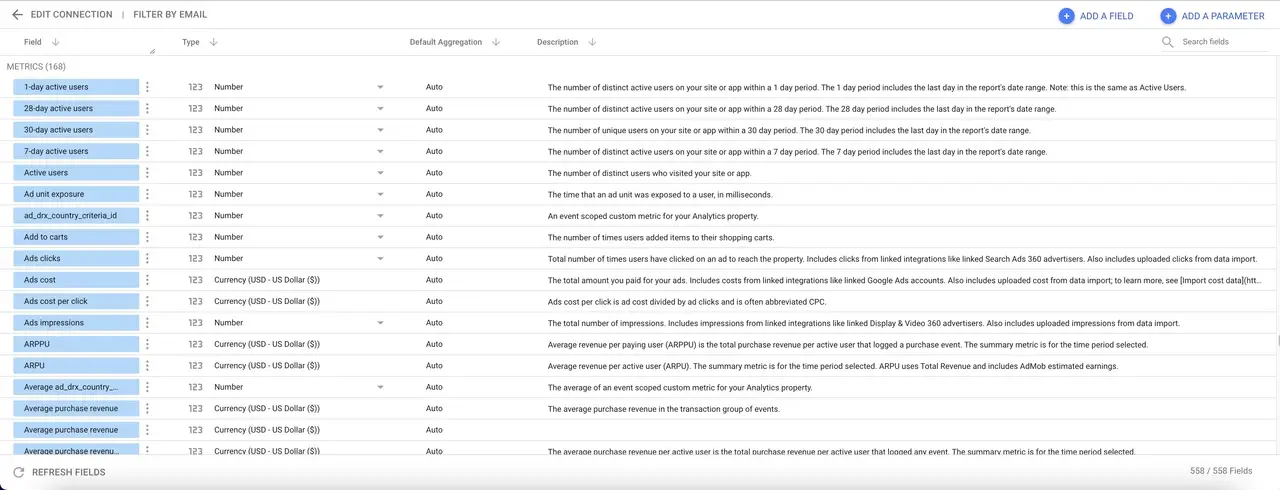
Metrics are the quantitative values in your data that measure performance. They answer the how much or how many questions and are always numerical.
Characteristics of Metrics:
- Always numerical values.
- Used for measuring performance, calculating totals, or identifying trends.
- Provide actionable insights when paired with dimensions.
Examples of Metrics:
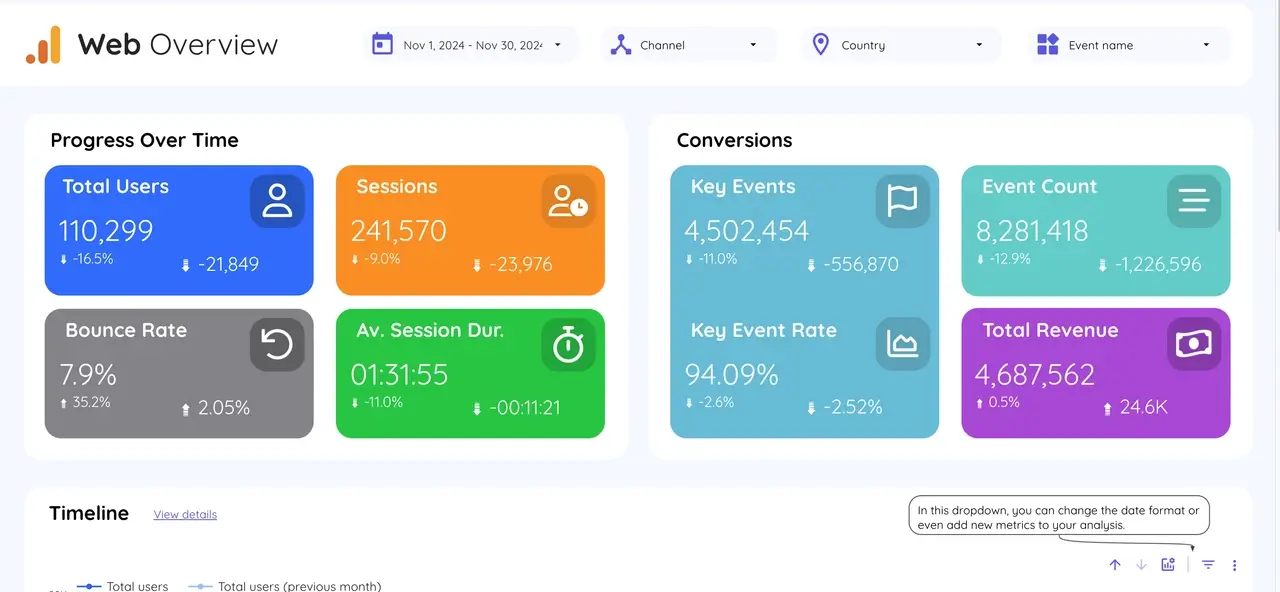
- Revenue, Clicks, Conversions, Bounce Rate.
Example:
In the same e-commerce dashboard, "Total Sales" is a metric that quantifies revenue for each "Region" (dimension).
Key Differences: Dimensions vs. Metrics
| Aspect | Dimensions | Metrics |
|---|---|---|
| Value Type | Always text or date-based | Always numerical |
| Purpose | Organize and categorize data | Measure and quantify performance |
| Examples | Campaign Name, Product Type, Date | Revenue, Units Sold, Conversion Rate |
How Dimensions and Metrics Work Together

Dimensions and metrics are complementary tools in Looker Studio dashboards:
- Dimensions provide the labels and categories for your data.
- Metrics quantify the performance of those labels.
Example: Website Traffic Report
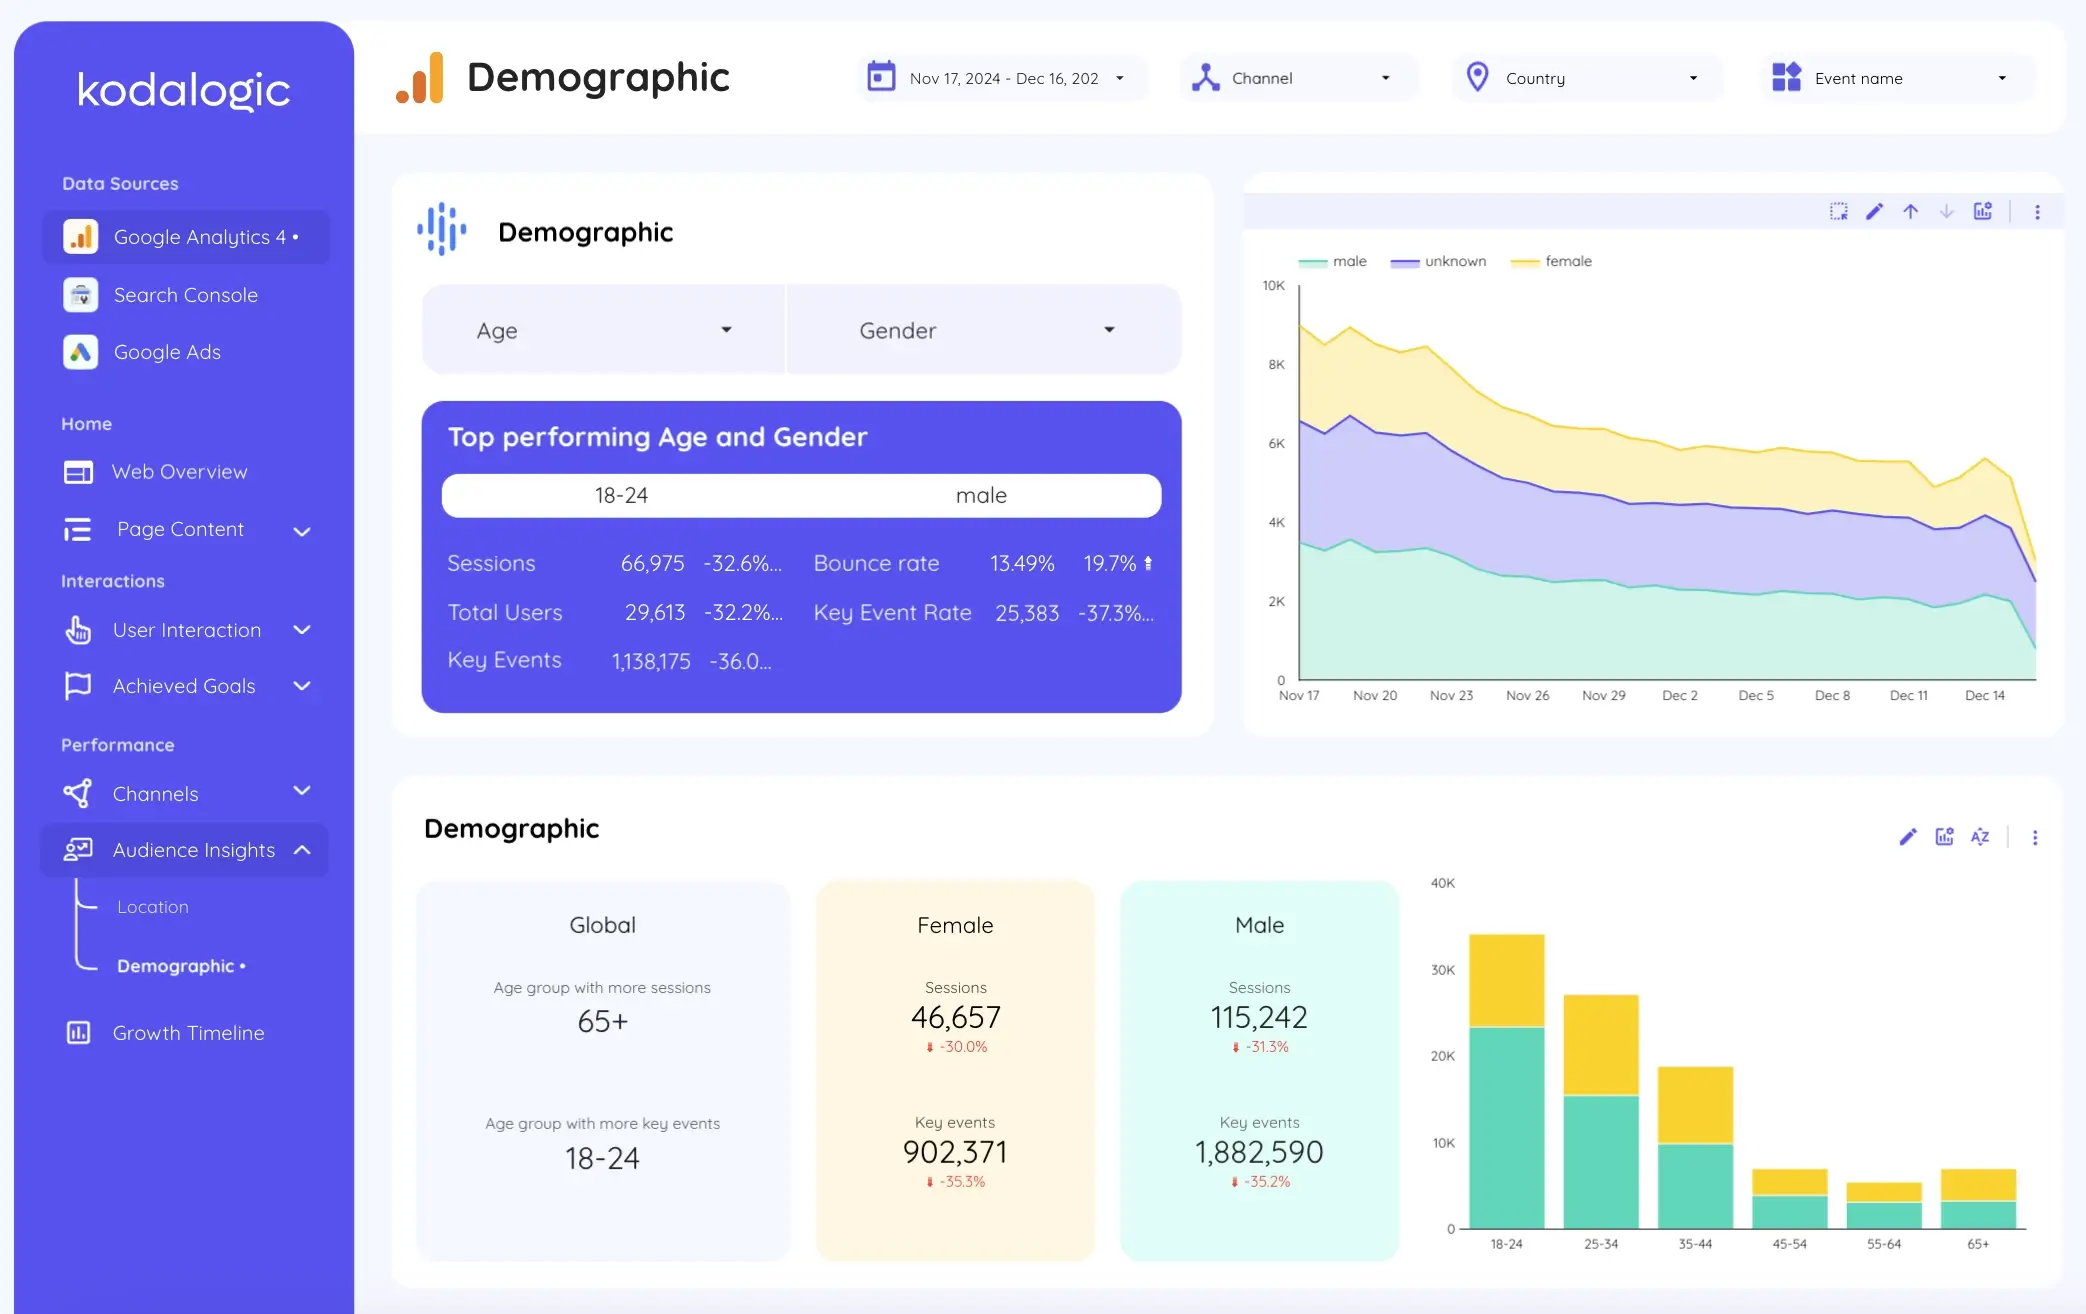
Let’s say you’re analyzing website traffic with a Google Analytics report template:
- Dimension: Traffic Source (e.g., Organic, Paid, Social).
- Metric: Sessions (number of visits) or Conversion Rate (percentage of conversions).
By combining these, you can identify which traffic sources are driving the most valuable sessions.
Best Practices for Using Dimensions and Metrics
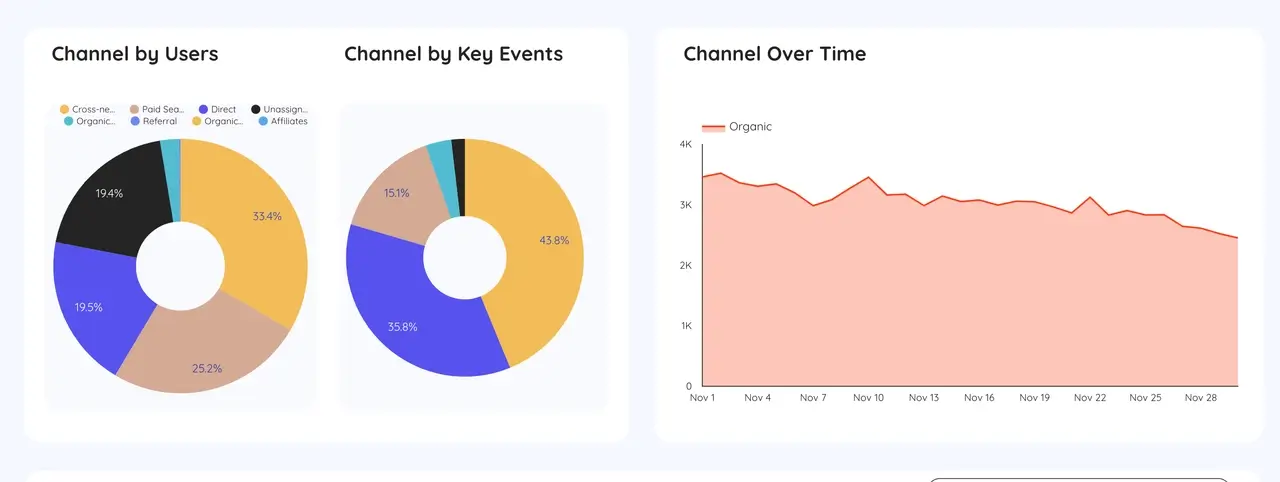
1. Use Dimensions to Add Context
Select dimensions that align with your goals. For example:
- Use "Traffic Source" to evaluate campaign performance in a Google Ads reporting template.
- Use "Product Category" to analyze sales performance in a GA4 Looker Studio template.
2. Focus on Key Metrics
Avoid overwhelming users with too many metrics. Focus on actionable KPIs like "Profit Margin" or "Conversion Rate" to ensure clarity in your reports.
3. Leverage Looker Studio Templates
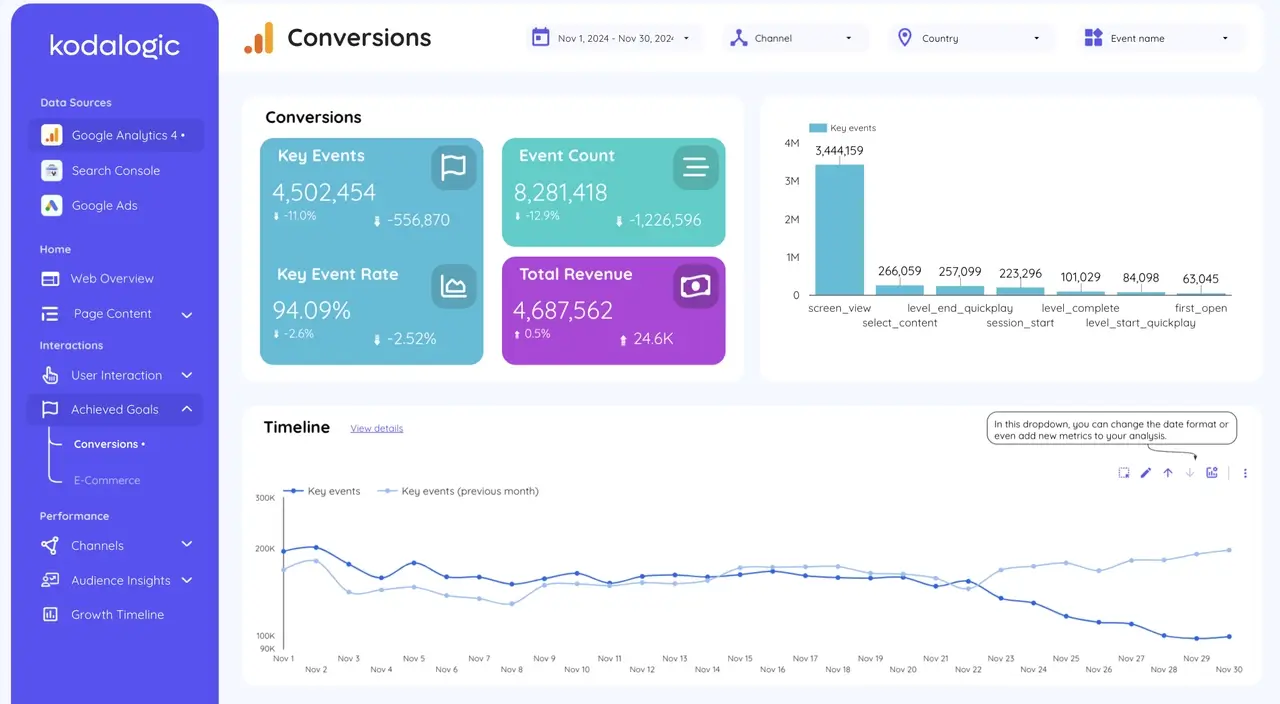
Pre-built Looker Studio templates are designed to seamlessly integrate dimensions and metrics. These templates, such as the e-commerce KPI dashboard, save time while providing actionable insights.
Common Use Cases in Looker Studio
E-commerce Dashboards
Use GA4 Looker Studio templates to combine dimensions like "Product Category" with metrics like "Revenue" to track sales trends.
Marketing Reports
Templates like the Google Ads report template or Facebook Ads template help you combine dimensions such as "Traffic Source" with metrics like "Click-Through Rate" for better campaign insights.
Finance and Operations
Use a Looker Studio scorecard to display key metrics like "Total Revenue" filtered by dimensions such as "Quarter" or "Department."
Final Thoughts: Dimensions and Metrics in Looker Studio
Mastering dimensions and metrics is the foundation of building impactful dashboards in Looker Studio. By understanding that dimensions are always text or date-based and metrics are always numerical, you can create clear and actionable reports that answer critical business questions.
Whether you're designing with a Google Data Studio template, exploring using custom Looker Studio buttons for interactivity, pairing dimensions and metrics effectively ensures your dashboards provide meaningful insights.
Transform Your Dashboards Today
Are you ready to unlock the full potential of Looker Studio? Don’t just analyze data—tell a story that drives action. Discover the best Looker Studio templates for e-commerce, marketing, and finance, and start creating reports that are as beautiful as they are powerful.
Browse Premium Looker Studio Templates Now
From pre-built templates to tailored solutions, we’ve got everything you need to build dashboards that wow your audience and simplify decision-making. Let’s take your reporting to the next level!