22 of February of 2025
GA4 Report Template: Save Hours on Analytics Reporting

Isaac Correa
Google Analytics
Looker Studio Templates
SEO & Marketing Dashboards
Stop wasting time on GA4 manual reports. Use this Looker Studio dashboard to automate analytics reporting and deliver interactive, real-time insights.
The GA4 Report That Saves You Hours Every Week
Tracking website performance in Google Analytics 4 (GA4) should be easy—but in reality, it’s a frustrating, time-consuming process.
If you’re managing analytics for clients, you’ve probably experienced this firsthand:
- Manually extracting data from GA4’s cluttered interface.
- Taking endless screenshots to build reports.
- Applying filters manually just to see basic insights.
- Spending hours every week compiling data instead of analyzing it.
And after all that effort, the final report is often messy, inconsistent, and difficult to understand.
This stops now.
With a custom GA4 dashboard in Looker Studio, you get a structured, interactive, and fully automated report that eliminates manual work and gives you instant access to critical insights.
Why GA4 Reports Are So Hard to Build Manually
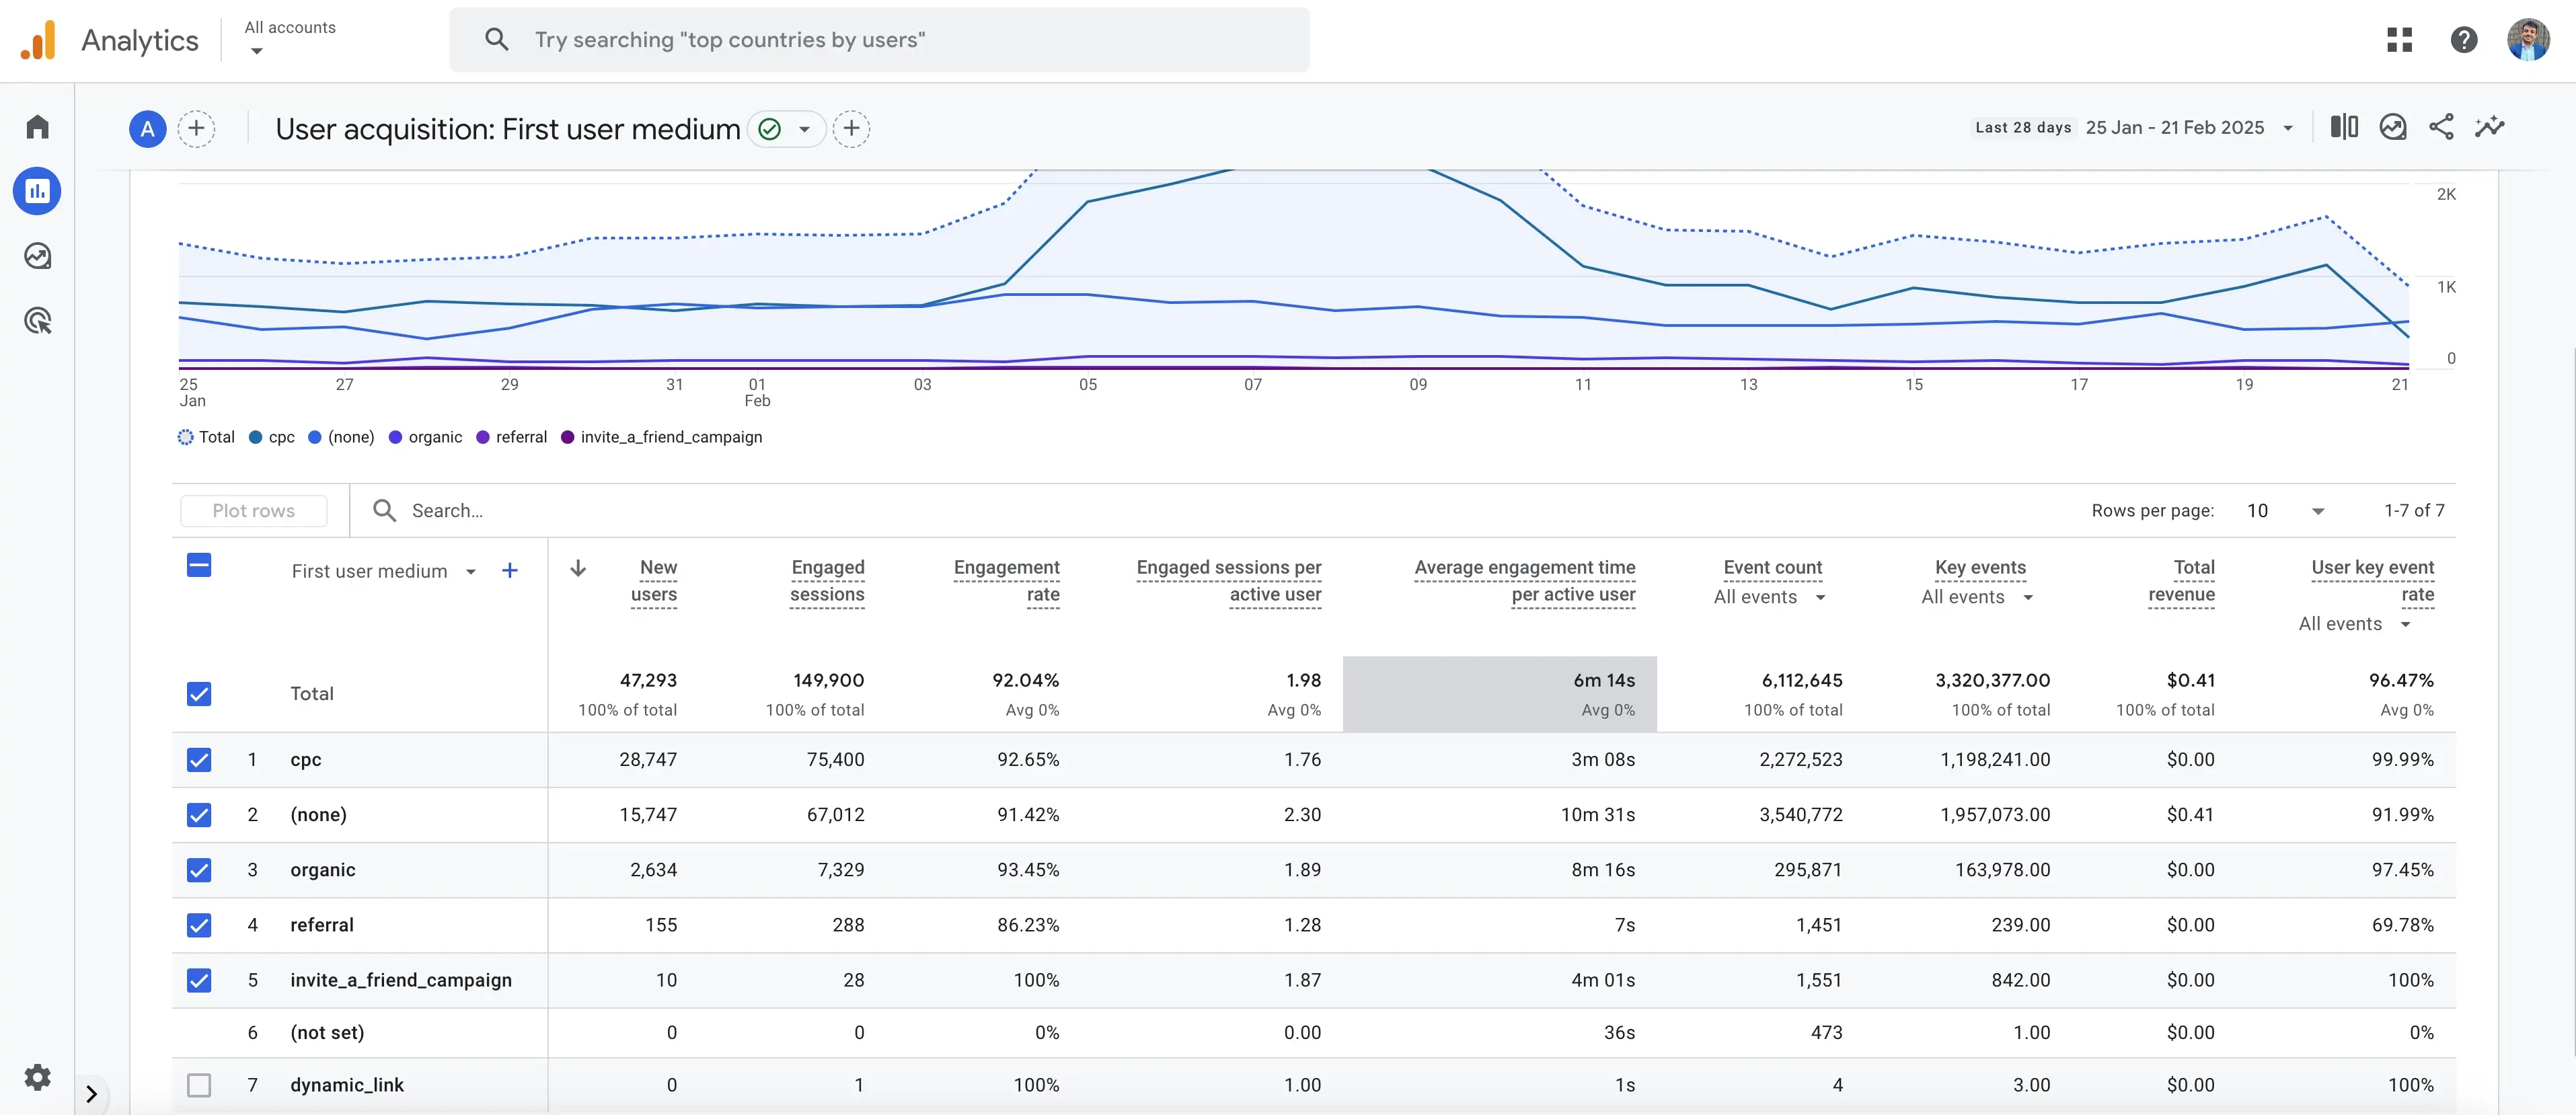
GA4 is designed to track user behavior, not to present data in a clear, structured way.
The biggest reporting challenges in GA4:
❌ No built-in client-ready reports—you have to create everything from scratch.
❌ Complex navigation—key data is buried in multiple menus.
❌ No easy filtering—you must manually adjust filters every time.
❌ No branding or customization—all reports look the same.
❌ No automation—you must export and format data manually.
This is why many analysts resort to screenshots and Word documents—because GA4 simply doesn’t provide an efficient way to build reports.
The Solution: A GA4 Dashboard in Looker Studio
A GA4 dashboard in Looker Studio solves all these problems by providing:
✔ A structured report with all your key data in one place.
✔ Live updates—no more manual exports or screenshots.
✔ Custom branding—match reports to your agency or client’s brand.
✔ Interactive filters—adjust time periods, channels, and events instantly.
✔ Automated delivery—schedule PDF reports without manual work.
Instead of spending hours every week compiling reports, you can get instant, actionable insights.
How the GA4 Report is Structured
One of the biggest advantages of this dashboard is its intuitive structure. Unlike GA4, where data is scattered across multiple sections, this report follows a clear, logical flow so you can quickly find what you need.
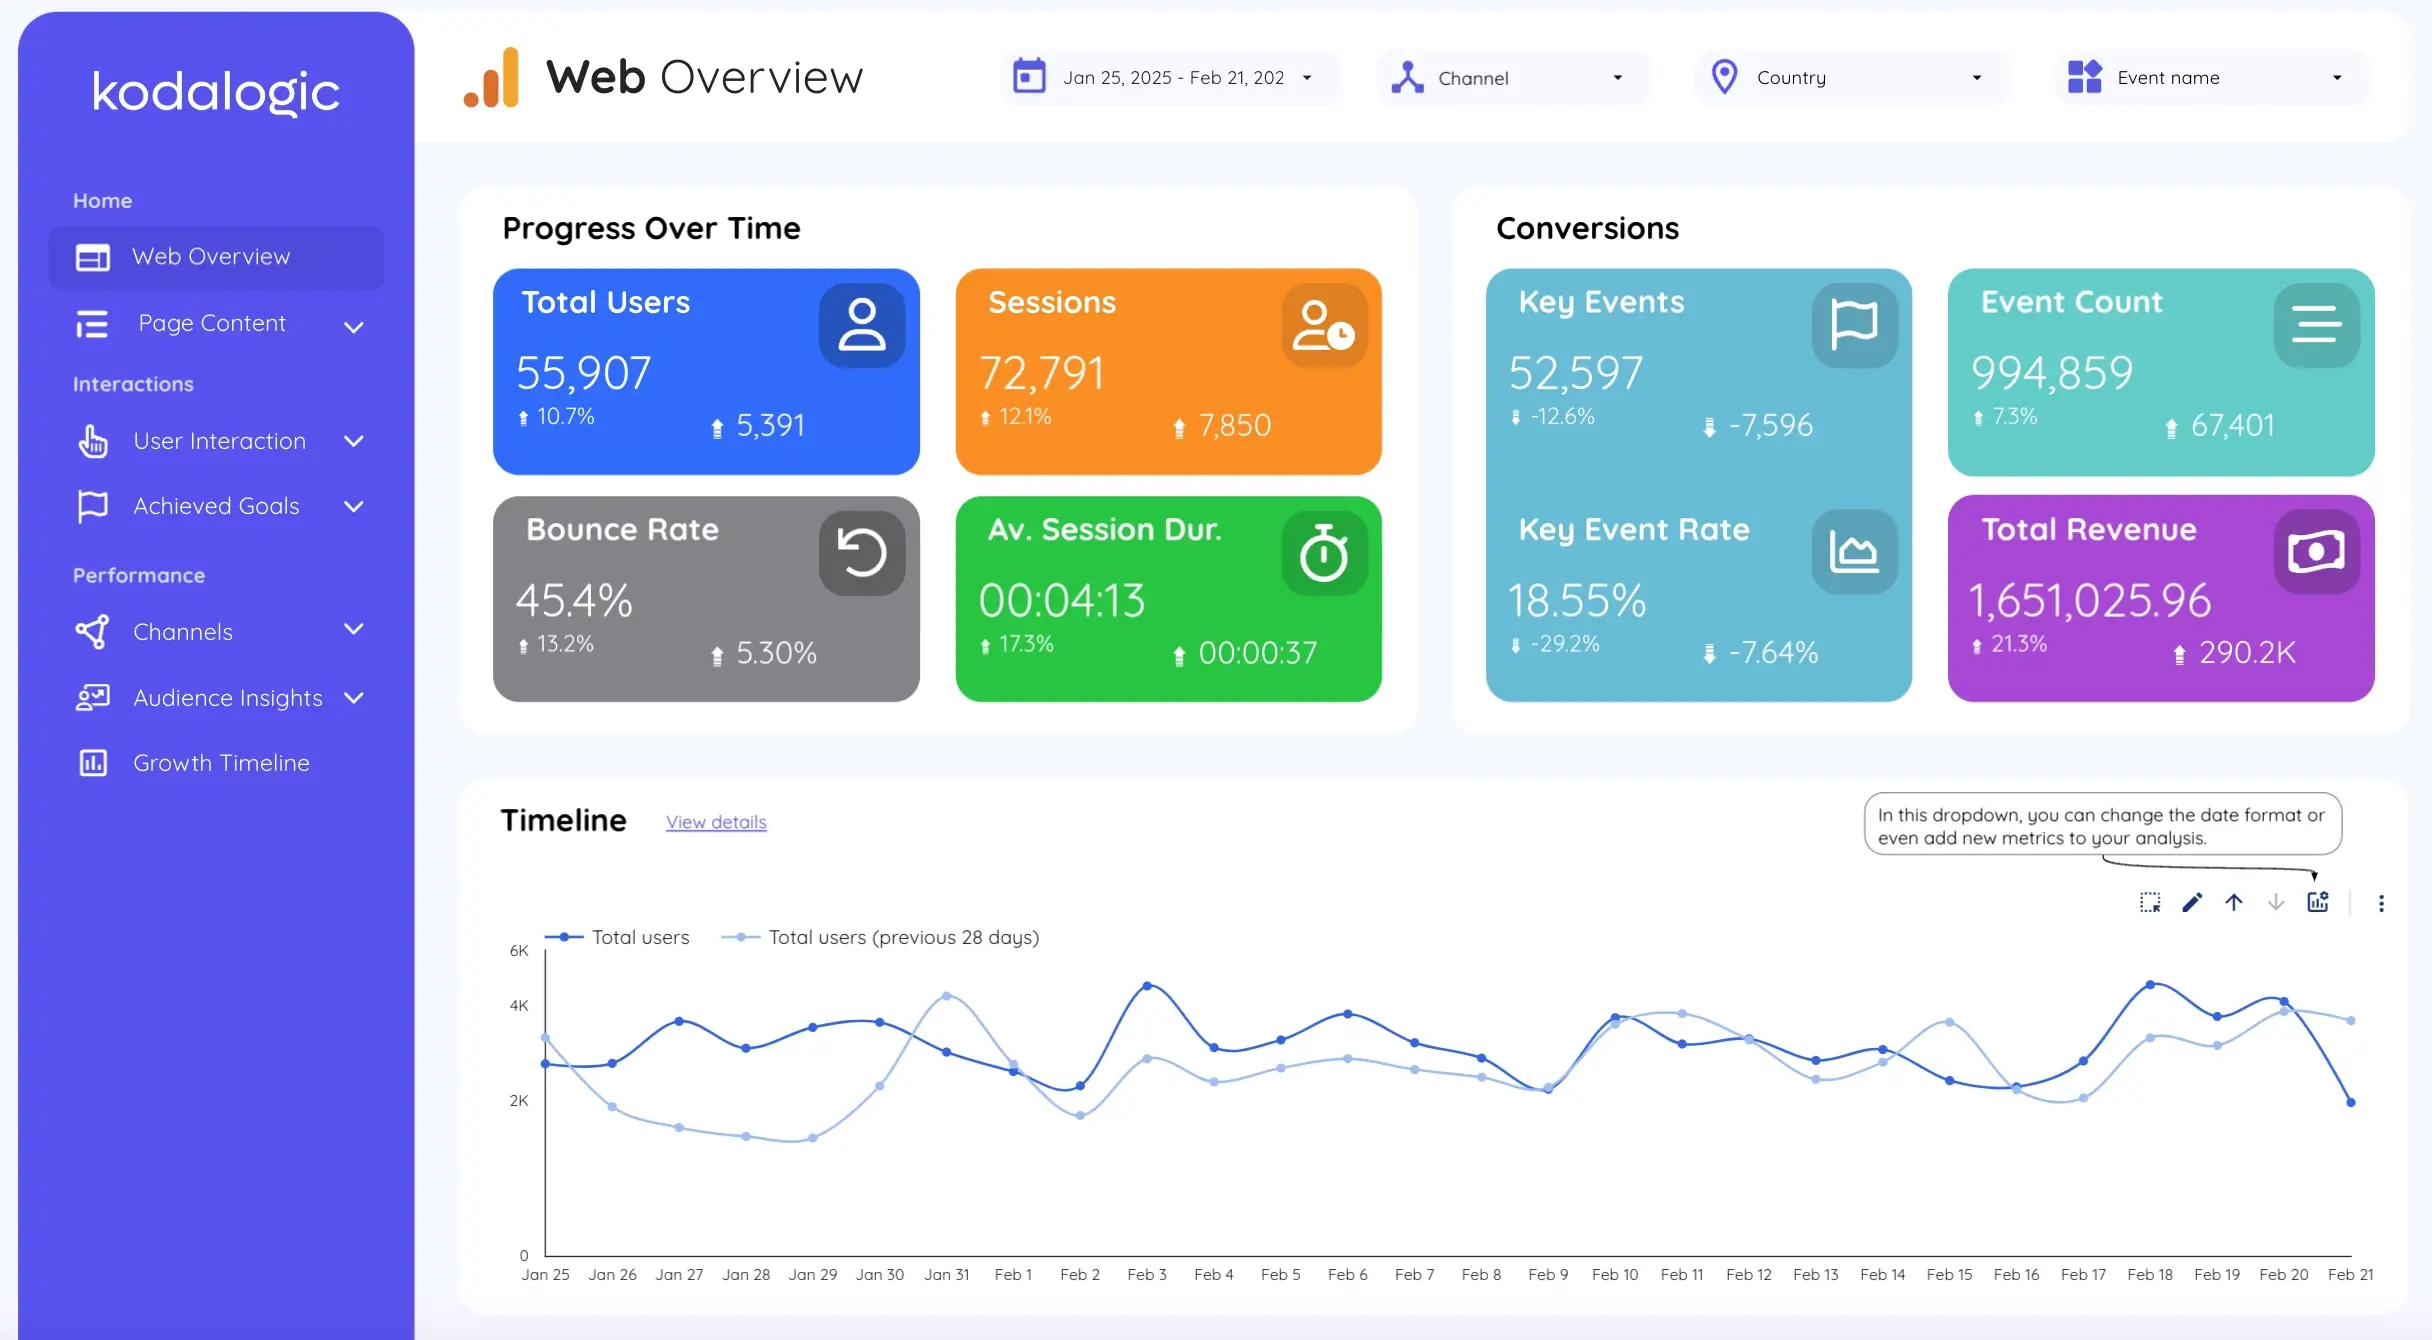
1. Overview: A Complete Snapshot of Your Business
The Overview page provides a high-level summary of your key performance metrics, including:
- Total traffic—how many users visit your site.
- Top-performing channels—where your visitors are coming from.
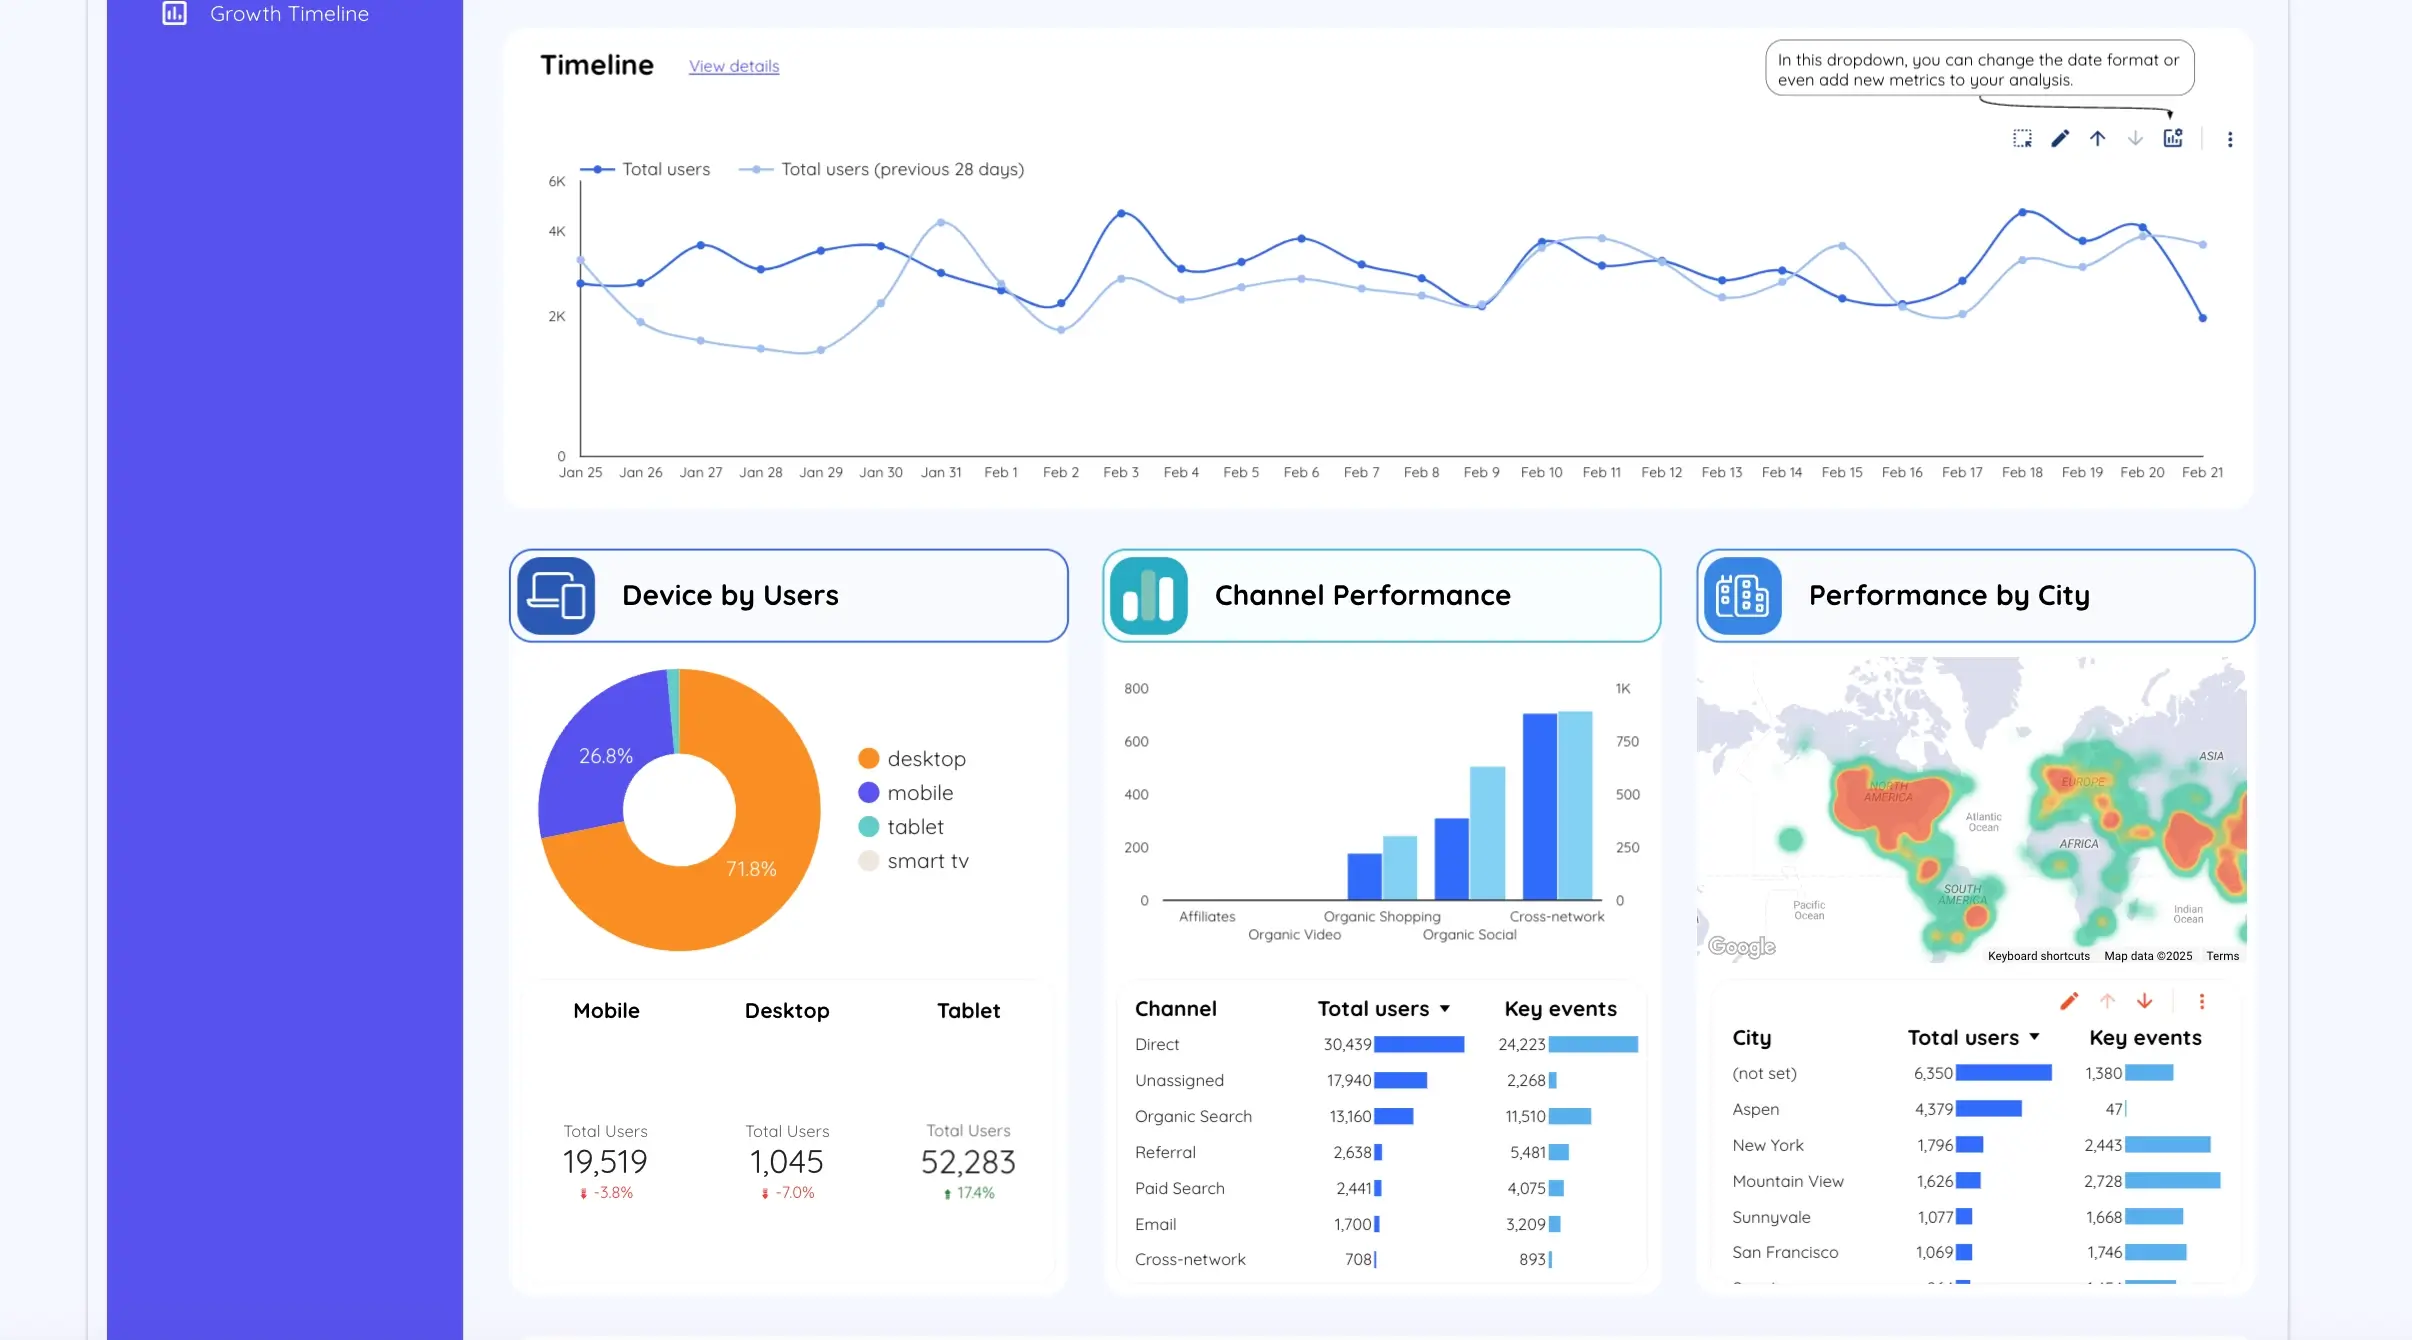
- User behavior over time—how engagement changes daily, weekly, or monthly.
- Geographic distribution—which locations drive the most traffic.
- Device breakdown—mobile vs. desktop performance.
This page immediately highlights trends, so you don’t have to dig through multiple GA4 reports.
2. Page Performance: Understand Which Pages Drive Engagement
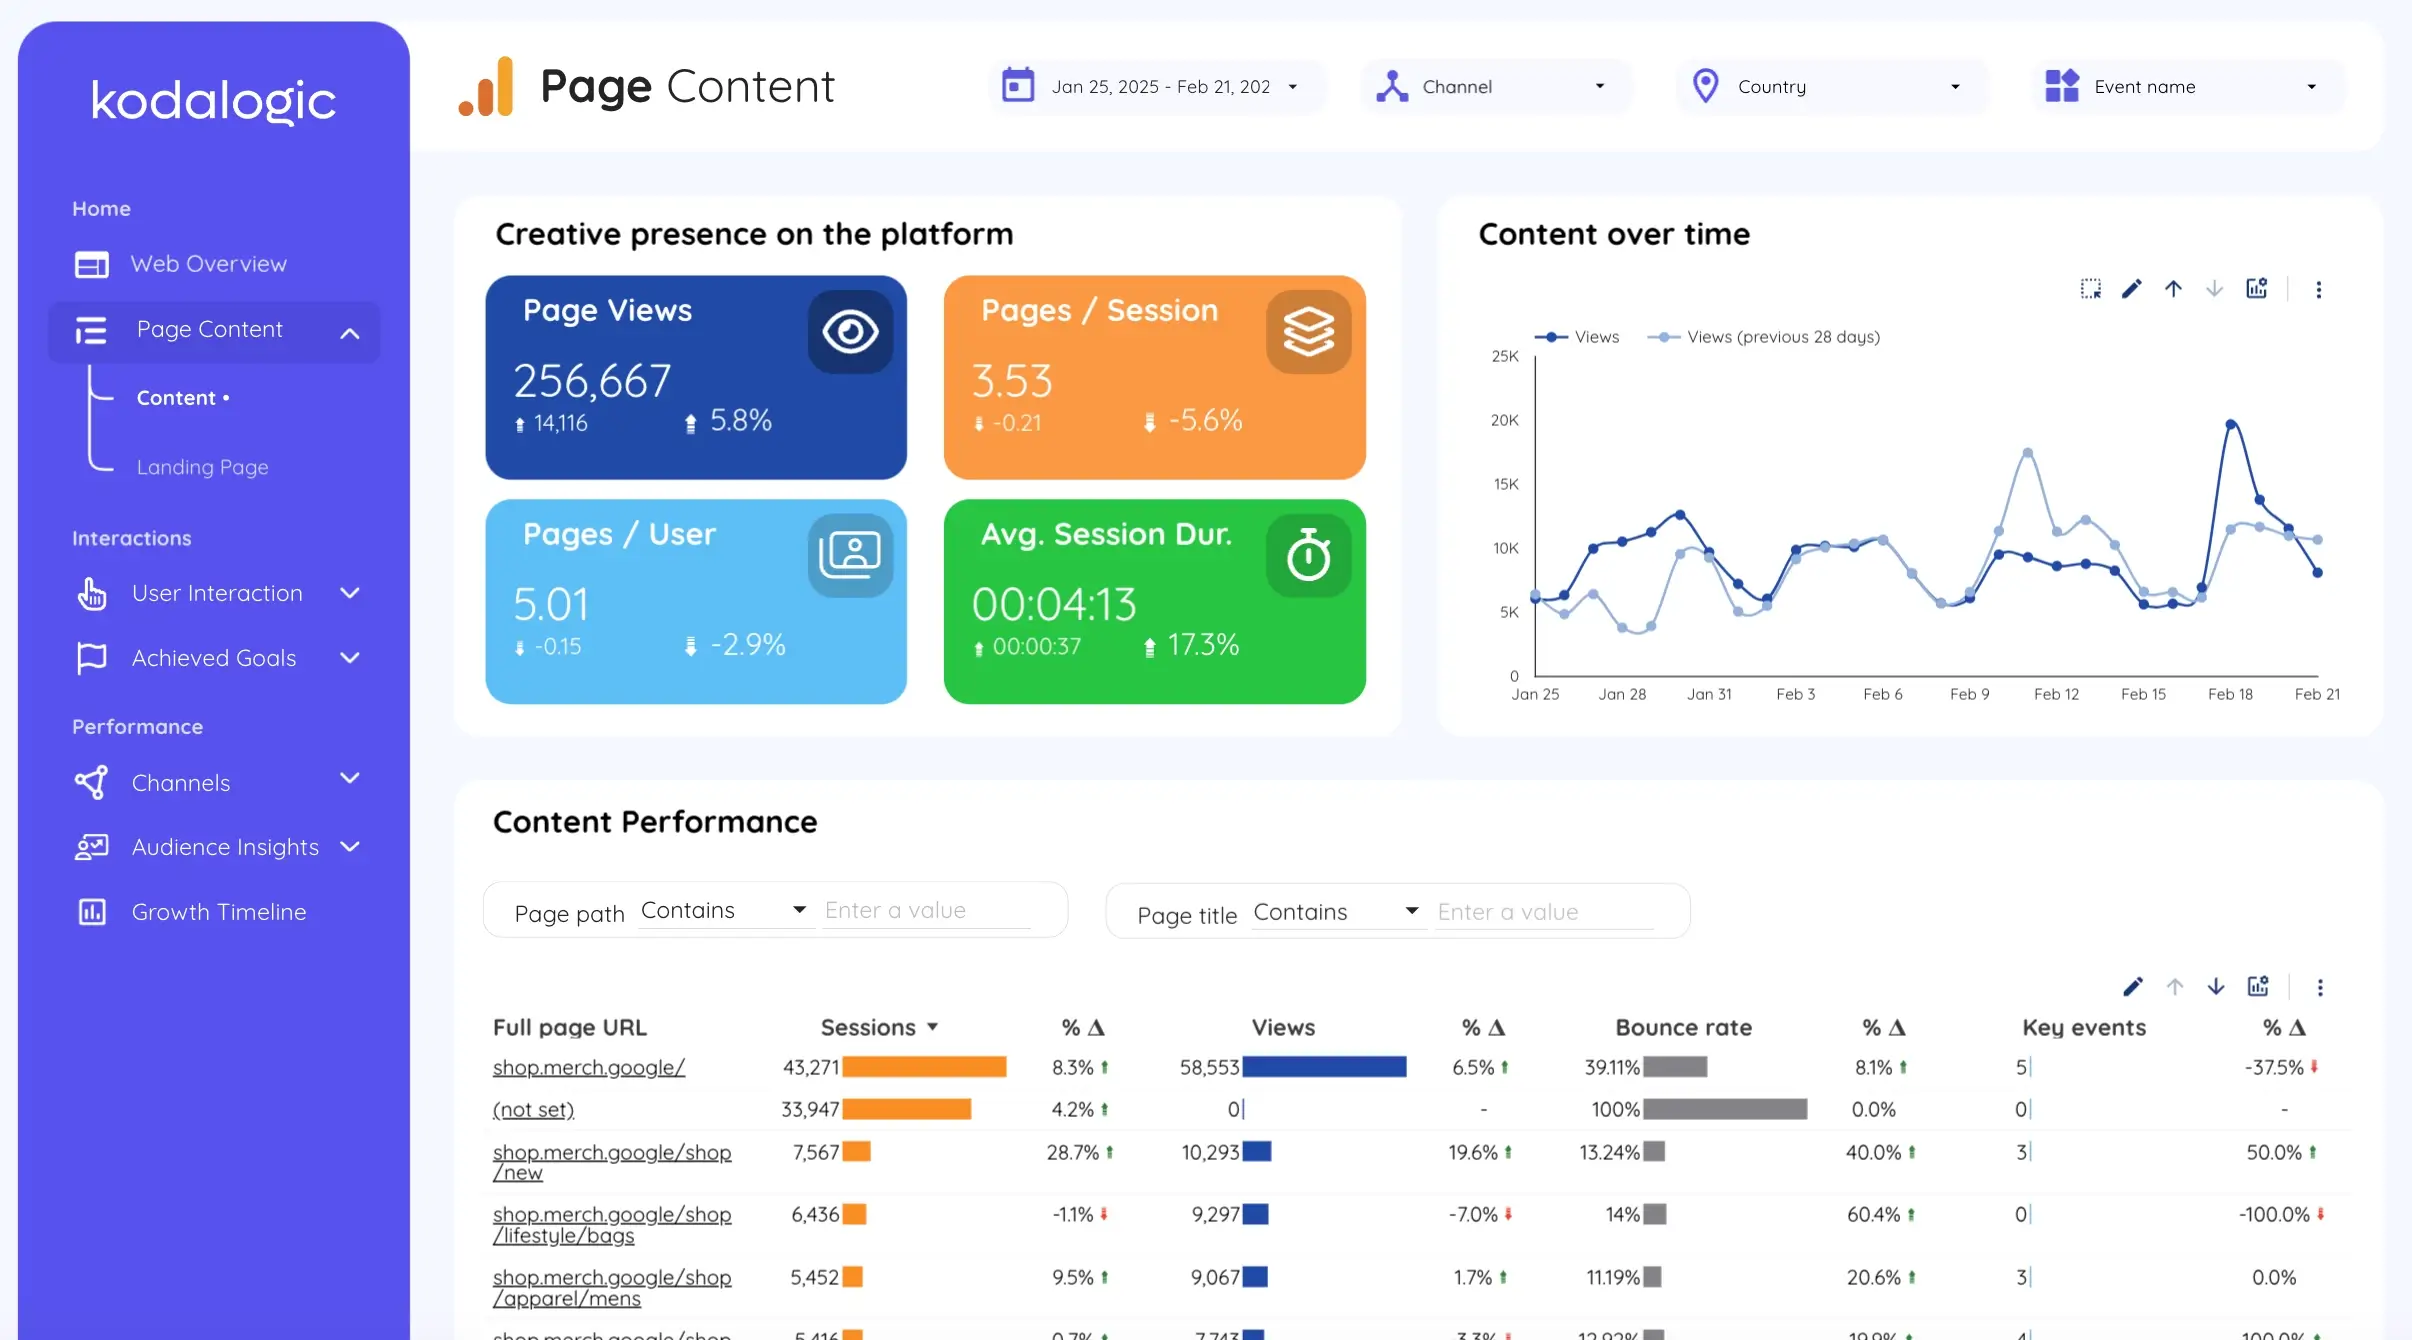
Instead of guessing which content works best, this report gives you:
✔ A full breakdown of all pages on your site.
✔ Engagement metrics for each page—sessions, bounce rate, and time on page.
✔ Performance over time—see how content trends evolve.
This allows you to identify which pages attract the most traffic and conversions—without spending hours filtering data manually.
3. User Interaction: How Visitors Engage with Your Site
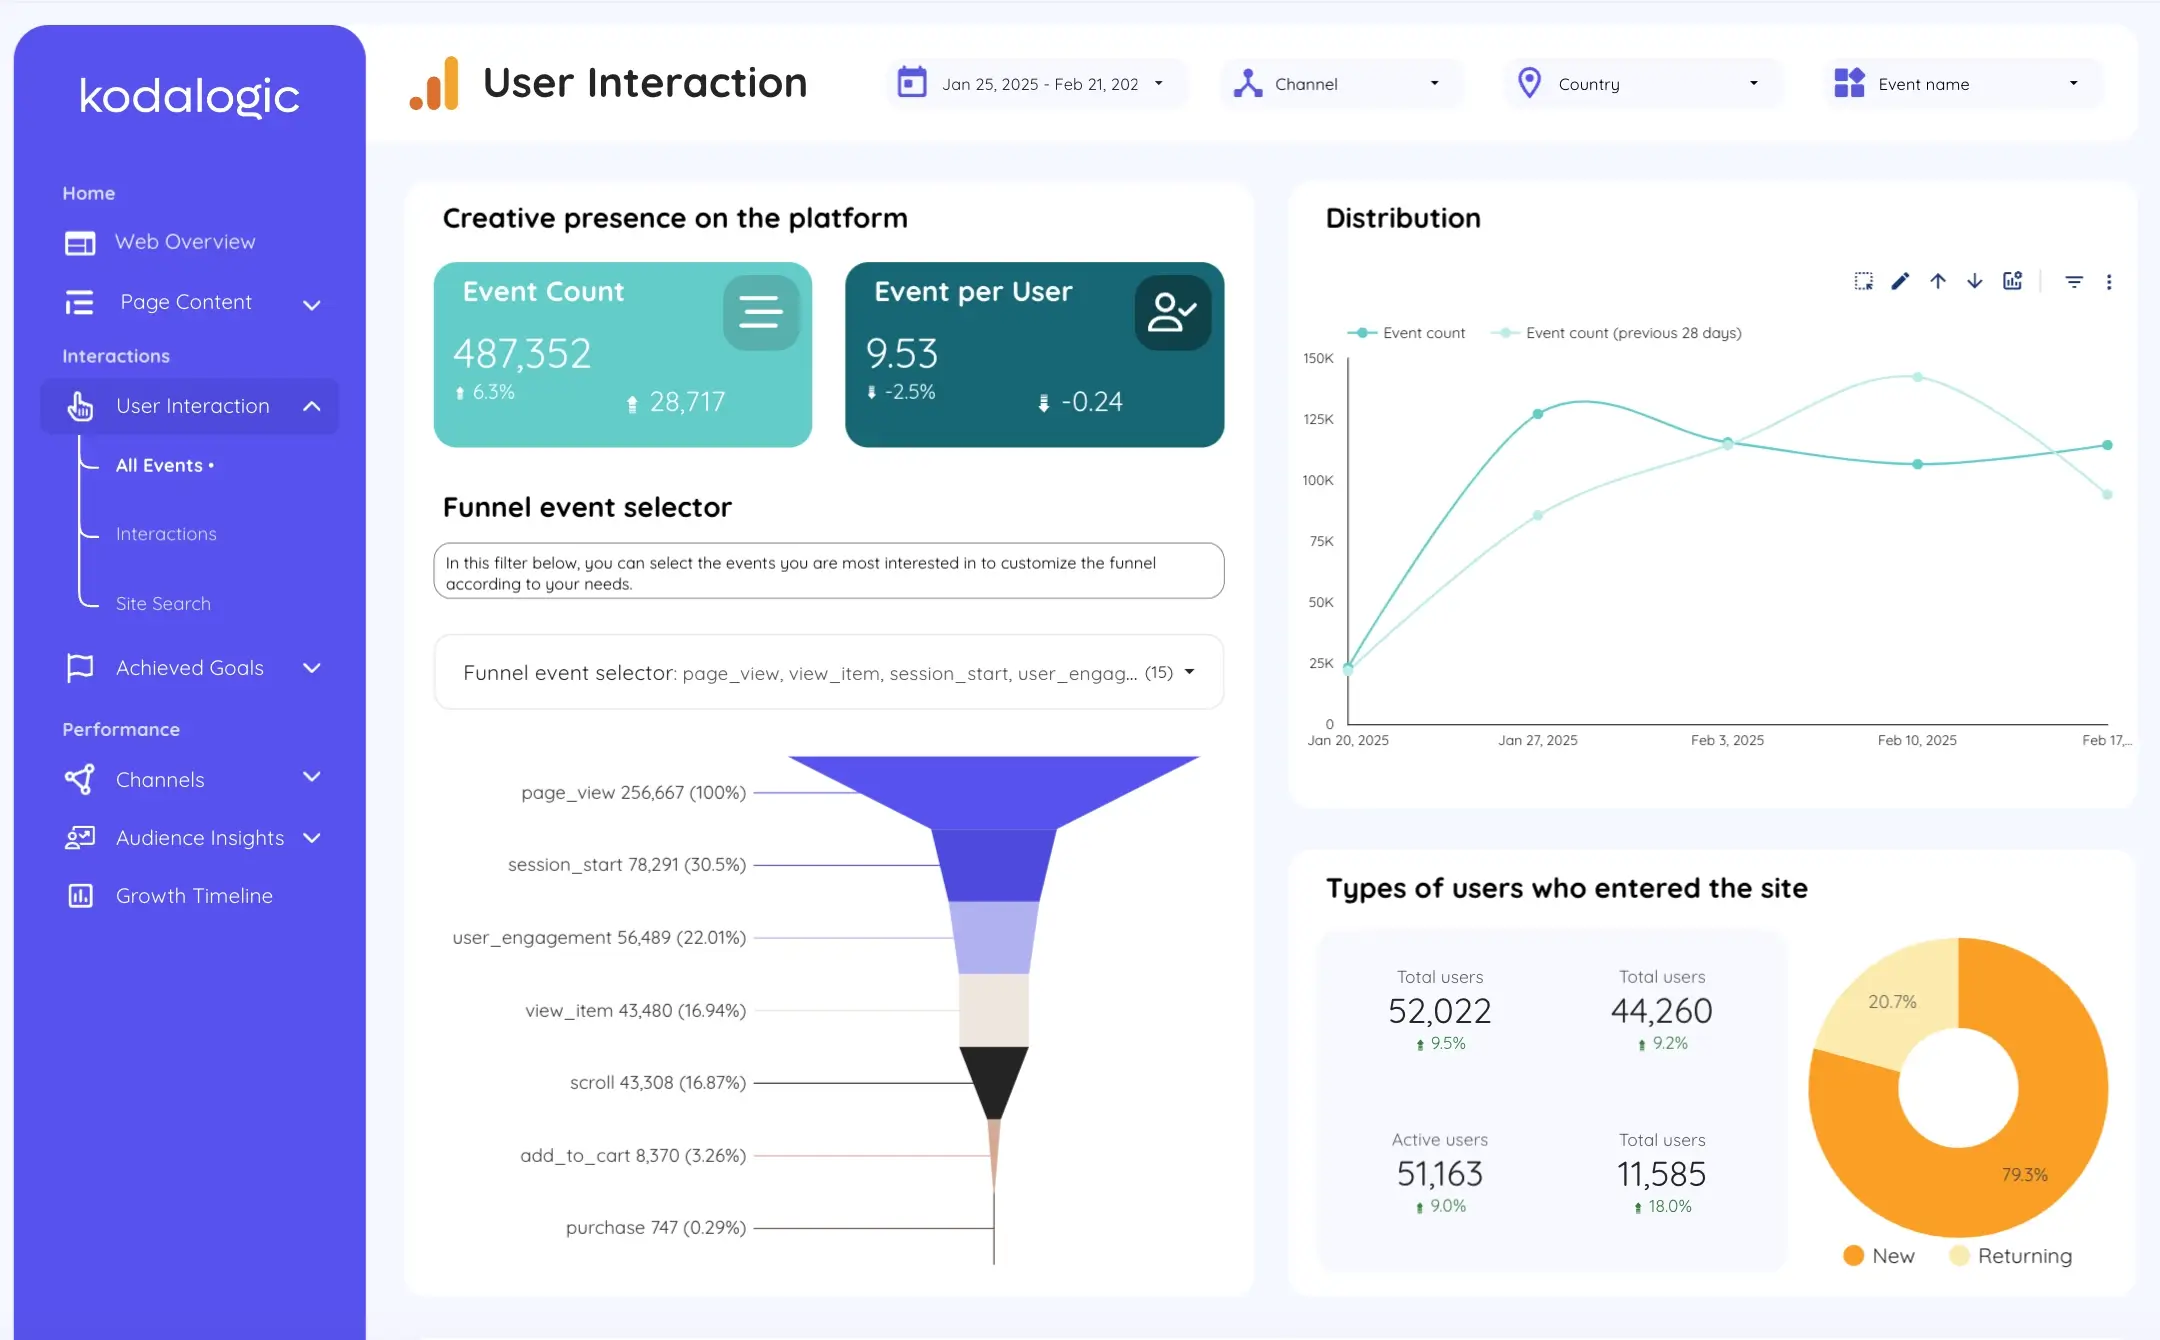
Understanding how users interact with your website is crucial for optimizing user experience.
✔ Funnel visualization—track the full customer journey.
✔ Event tracking—see which interactions are most common (clicks, video plays, downloads).
✔ Search behavior—what users search for on your site.
Instead of guessing how people navigate your site, you can see exactly where they drop off and where they engage the most.
4. Achieve Goals: Conversions & E-Commerce Performance
![]()
The Achieve Goals section is split into two critical parts:
✔ Conversions:
- Track all pre-set conversion goals.
- See which actions drive the most results.
- Compare conversion rates across traffic sources.
✔ E-Commerce:
- Monitor revenue and sales performance.
- See which products sell the most.
- Analyze which devices and channels drive the highest revenue.
This page removes the complexity of GA4’s e-commerce tracking, making it easy to see what’s working and what needs improvement.
Manual GA4 Reports vs. Looker Studio GA4 Reports
| Manual GA4 Reports | Looker Studio GA4 Reports |
|---|---|
| Requires hours of manual work every week | Fully automated—updates in real time |
| Screenshots pasted into Word or PowerPoint | Interactive dashboard—filter and explore data in real time |
| No structured overview | Clear report sections for easy navigation |
| No client branding options | Custom colors, logos, and branding |
| Manual PDF exports and emails | Automated scheduling—never send a report manually again |
Instead of wasting time compiling data, you can spend time analyzing it.
Get the GA4 Dashboard and Never Build a Manual Report Again
If you’re tired of spending hours on manual GA4 reports, it’s time to upgrade.
With this automated Looker Studio dashboard, you get:
✔ A clean, structured report—all key data in one place.
✔ Real-time updates—no need for manual exports.
✔ Custom branding—match reports to your agency or client.
✔ Automated delivery—set it and forget it.
Get the GA4 Report Now and take control of your analytics.