24 of November of 2024
Mastering Data Sources in Looker Studio: A Comprehensive Guide

Isaac Correa
Data Integration & Sources
Discover how to connect, customize, and analyze data using Looker Studio’s versatile data sources. Learn step-by-step processes for creating impactful dashboards with Google and third-party connectors.
Mastering Data Sources in Looker Studio: A Comprehensive Guide
Unlock the full potential of your data with Looker Studio's seamless integration capabilities.
Introduction
Data is the backbone of every successful business decision, but making sense of it can feel overwhelming without the right tools. Looker Studio simplifies this process by offering an intuitive platform to connect, analyze, and visualize data from multiple sources—all in one place.
Imagine pulling insights from Google Analytics, blending it with sales data from Google Sheets, and presenting it in a sleek, interactive dashboard. With Looker Studio, you don’t need to be a data expert to create reports that make an impact. Whether you're tracking website performance, analyzing ad campaigns, or measuring customer behavior, Looker Studio provides the tools to turn numbers into knowledge.
This guide will walk you through the types of data sources available, how to connect them, and ways to maximize your reporting capabilities.
Understanding Looker Studio Data Sources

At its core, Looker Studio enables users to connect, visualize, and analyze data from multiple sources in a single, unified interface. Whether from web analytics, spreadsheets, or cloud databases, Looker Studio streamlines reporting and decision-making processes.
Key Features
- Versatile Data Connectors: Support for over 24 native Google connectors and multiple third-party integrations.
- Real-Time Data Updates: Automatic synchronization ensures your reports are always current.
- Customizable Dashboards: Create tailored visualizations aligned with business objectives.
Types of Data Connectors in Looker Studio
1. Native Google Connectors
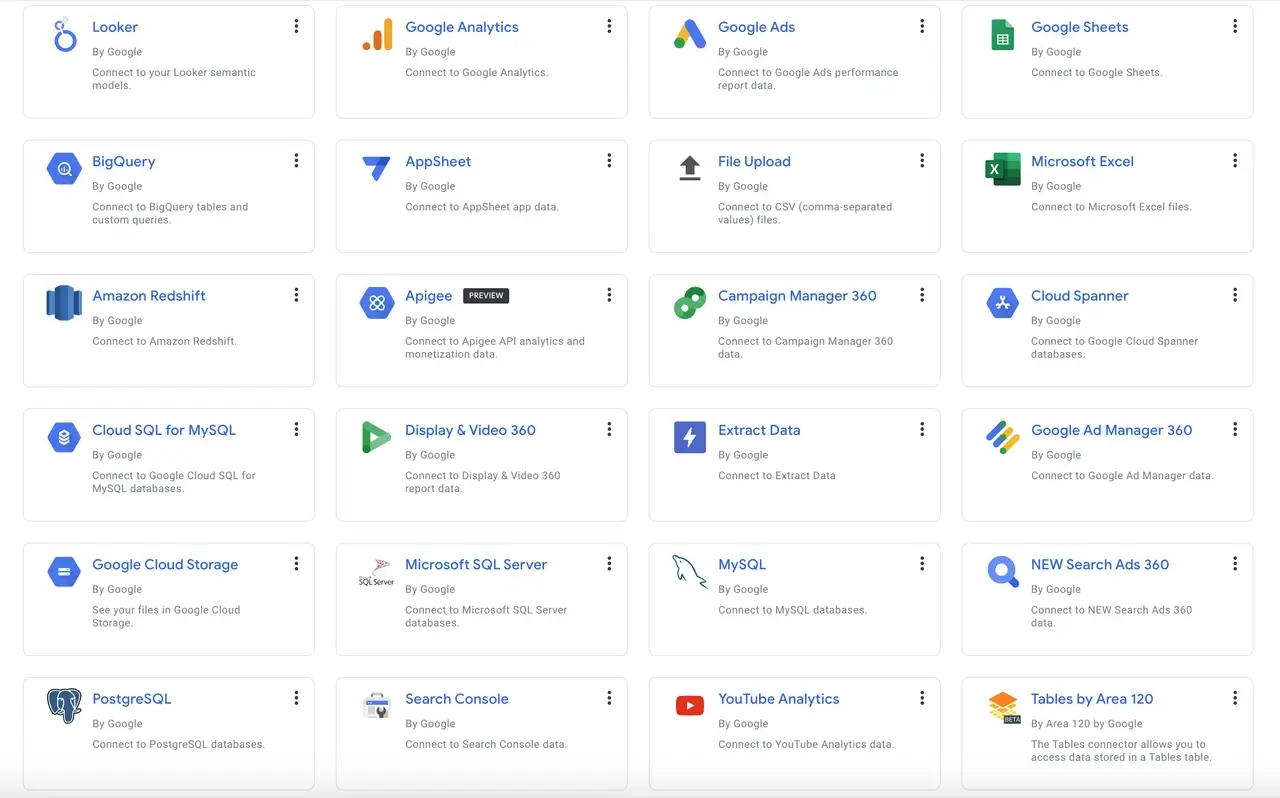
Looker Studio currently offers 24 native Google connectors, enabling direct integration with Google’s suite of tools. These connectors are designed for seamless data synchronization, ensuring efficient reporting and analysis.
| Connector | Description |
|---|---|
| Looker | Connect to Looker semantic models for advanced reporting. |
| Google Analytics 4 | Monitor website traffic and user behavior. |
| Google Ads | Track advertising performance and ROI. |
| Google Sheets | Import custom data from spreadsheets. |
| BigQuery | Query and analyze large datasets stored in Google BigQuery. |
| YouTube Analytics | Analyze video performance and audience engagement. |
| Microsoft Excel | Connect to Excel files for additional reporting flexibility. |
| Amazon Redshift | Pull data from Amazon Redshift databases. |
| Display & Video 360 | Analyze data from Display & Video 360 campaigns. |
| Search Console | Track website performance in Google Search results. |
Example: Integrating Google Analytics 4 allows you to monitor key metrics like traffic sources and conversions, providing insights for optimization.
2. Third-Party Partner Connectors
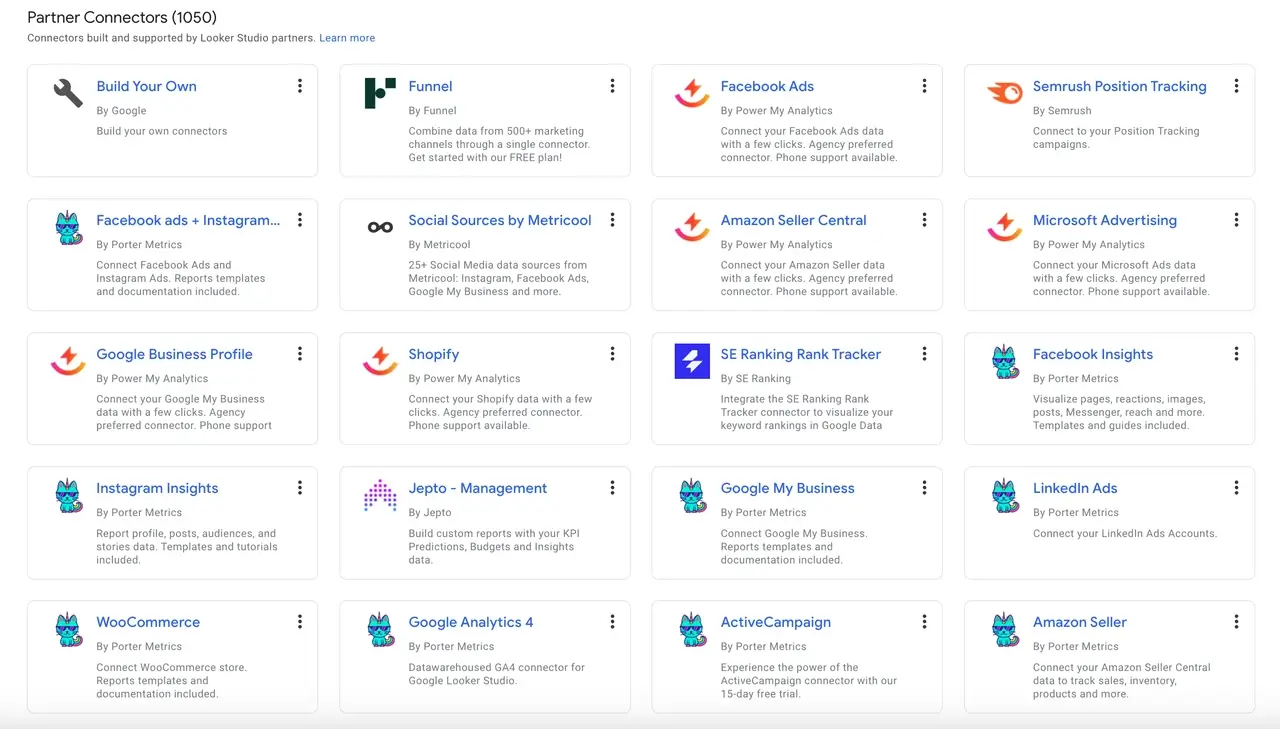
For data sources outside the Google ecosystem, Looker Studio supports third-party providers like Porter Metrics and Power My Analytics. These connectors enhance Looker Studio's versatility, allowing integration with platforms for social media ads, e-commerce, and CRMs.
| Provider | Supported Platforms |
|---|---|
| Porter Metrics | Facebook Ads, Instagram Ads, LinkedIn Ads, and Google Ads. |
| Power My Analytics | Shopify, Amazon Seller Central, eBay, and Pinterest Ads. |
| Supermetrics | Twitter Ads, Bing Ads, TikTok Ads, and more. |
*Note: Some third-party connectors require a subscription fee.**
Steps to Add a Data Source in Looker Studio
Follow these simple steps to integrate a new data source into Looker Studio:
- Access Looker Studio
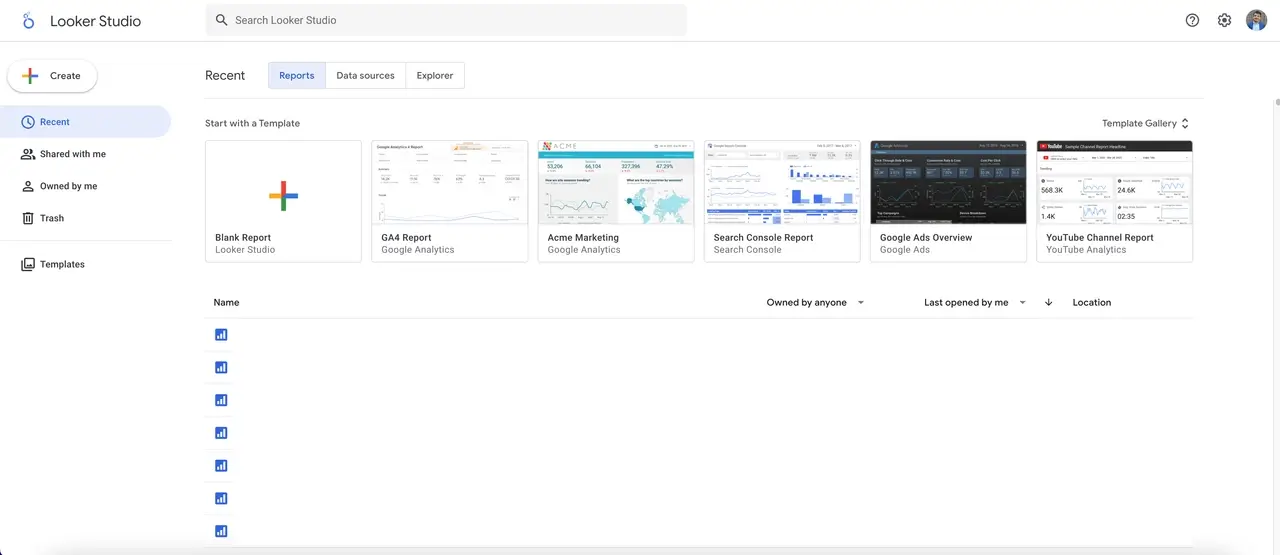
- Go to Looker Studio and sign in with your Google account.
- Create a New Report
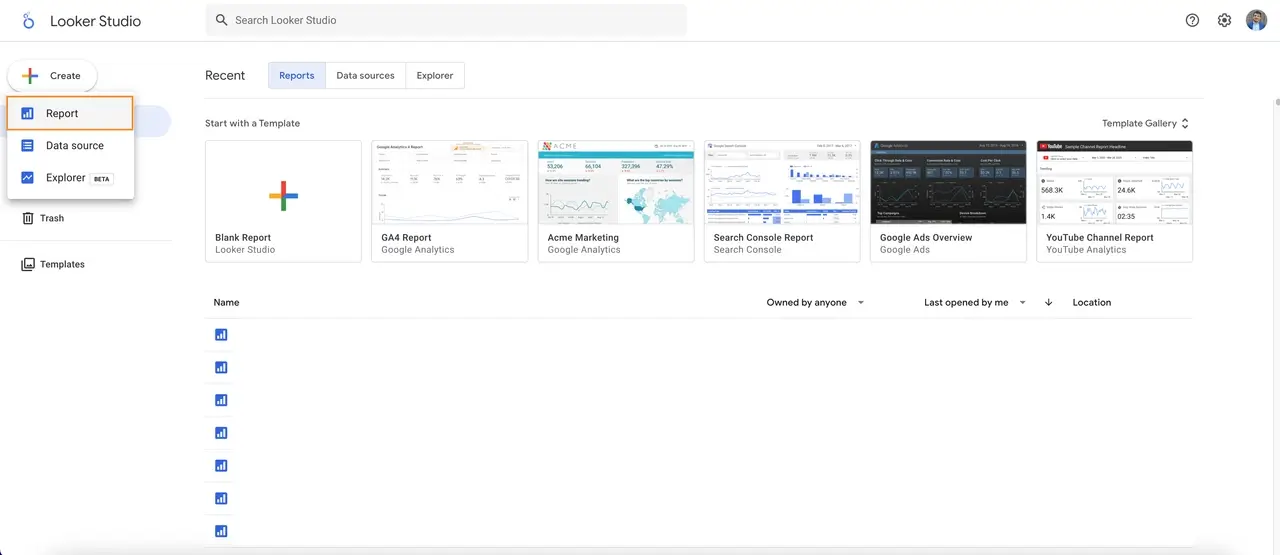
- Click on “+” and select “Blank Report”.
- Add Data Source
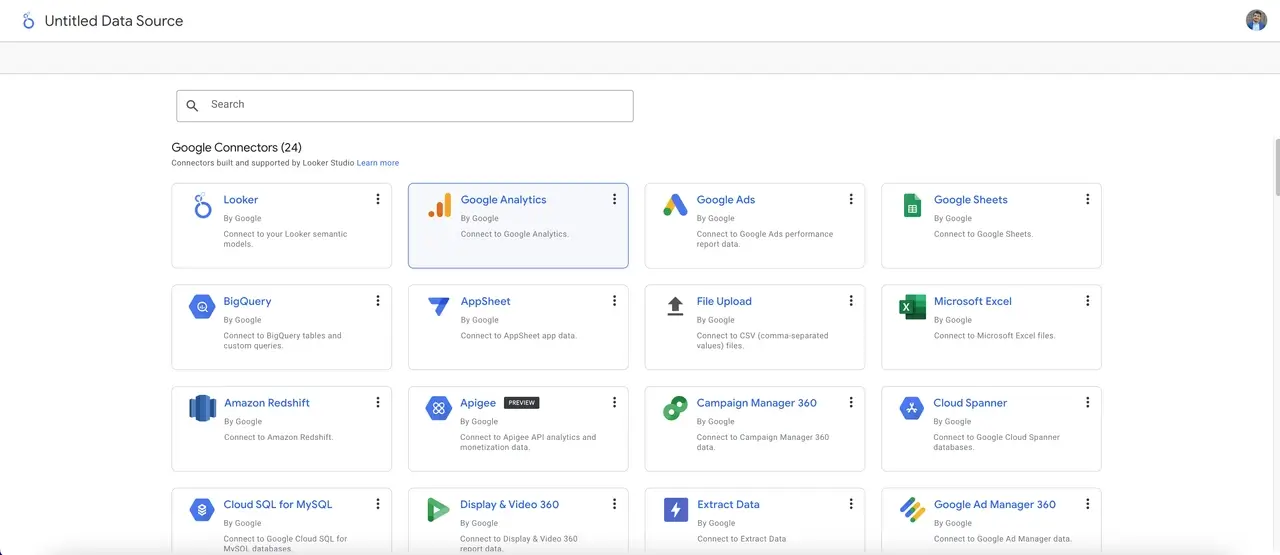
-
In the editor, click Add Data.
-
Search or browse for the desired connector (e.g., Google Analytics, BigQuery).
- Authorize Access
- Follow the prompts to grant permissions for the data source.
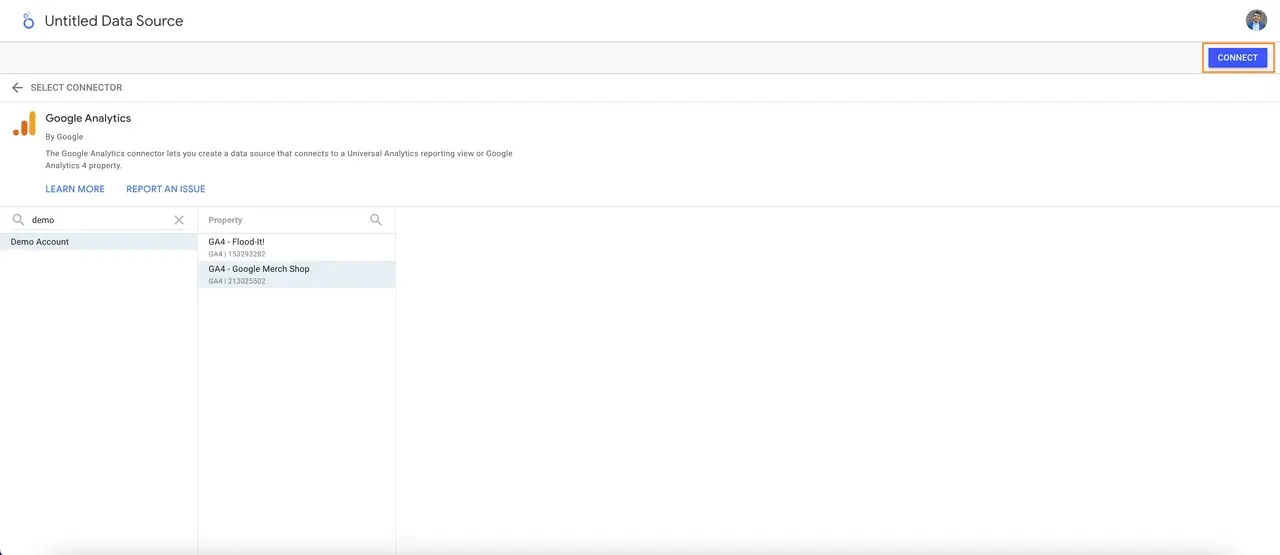
- Configure settings such as selecting specific accounts or properties.
- Customize Data Fields
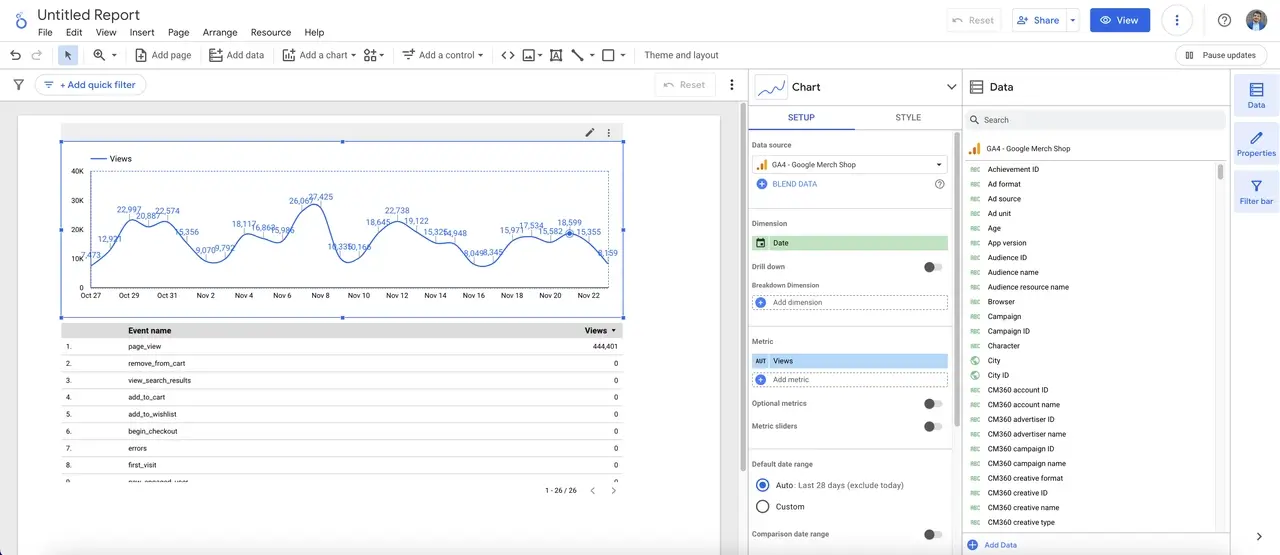
- Adjust dimensions and metrics to match your reporting needs.
- Build Your Dashboard
- Use Looker Studio’s intuitive tools to create interactive and insightful dashboards.
Enhancing Data Reports with Customization
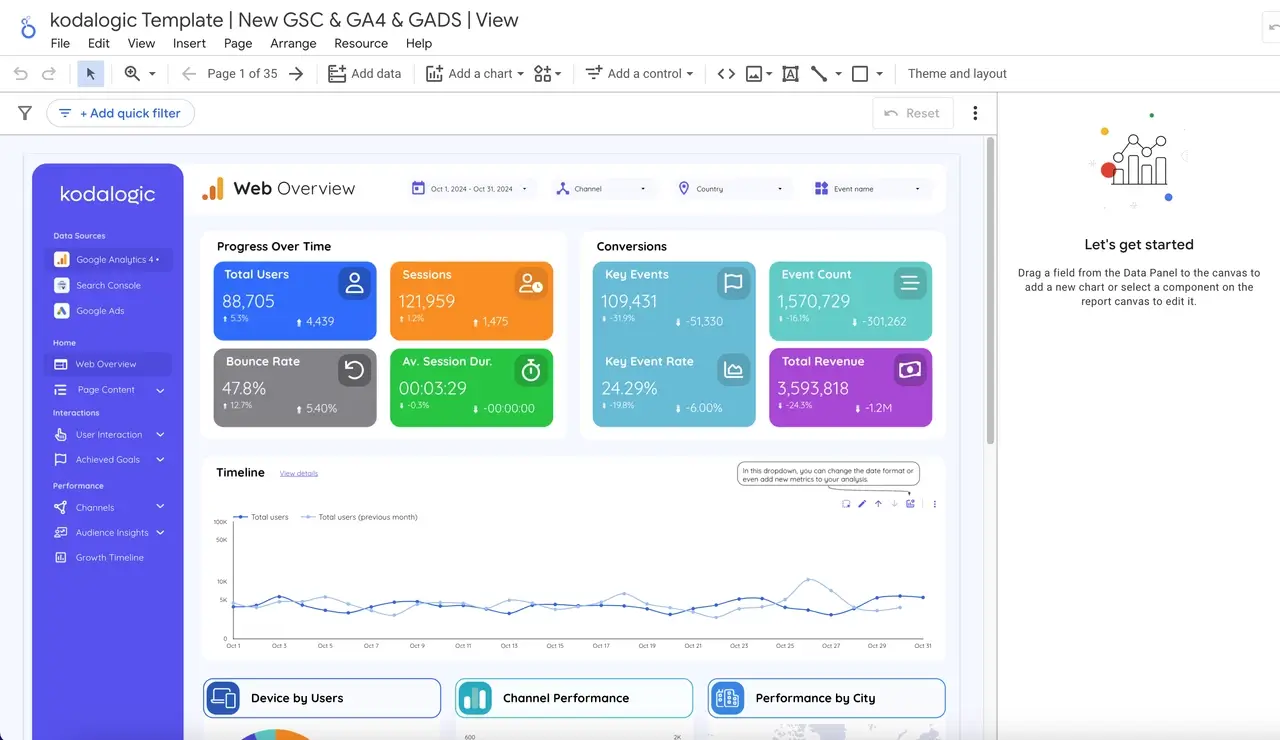
Looker Studio allows users to tailor their reports using calculated fields, advanced visualizations, and blended data sources.
Customization Options:
| Feature | Description |
|---|---|
| Calculated Fields | Derive new metrics using existing data. |
| Data Blending | Combine multiple data sources for unified insights. |
| Advanced Filters | Segment data based on specific criteria for focused analysis. |
Example: Use calculated fields to track conversion rates by dividing total conversions by session count.
Conclusion
By mastering Looker Studio’s data sources and custom field capabilities, businesses can unlock the full potential of their data for actionable insights.