22 of November of 2024
Mastering GA4 Reporting: Create Custom Events and Dashboards

Isaac Correa
Google Analytics
Looker Studio Templates

Discover how to optimize Google Analytics 4 reporting with templates, dashboards, and advanced GA4 techniques for actionable insights.
Mastering Google Analytics 4 Reporting: Custom Events, Explorations Tool and Custom Dashboards
Discover how to optimize Google Analytics 4 reporting with templates, dashboards, and advanced GA4 techniques for actionable insights.

Introduction: Why Optimize Your GA4 Reports?
Google Analytics 4 (GA4) is more than a tracking tool—it's a comprehensive platform designed to deliver powerful insights about your audience. When optimized, GA4 can transform the way you approach your business metrics, turning raw data into valuable, actionable insights.
Optimizing your GA4 reports helps you to:
- Save Time: Quickly find the metrics that are most relevant to your goals.
- Improve Precision: Customize your setup to capture the most accurate data.
- Gain a Competitive Edge: Make faster, data-driven decisions that keep you ahead.
For better reporting, tools like Google Data Studio templates and Looker Studio templates can elevate your dashboards with customizable and insightful layouts.
1. Use the Right Dimensions and Metrics
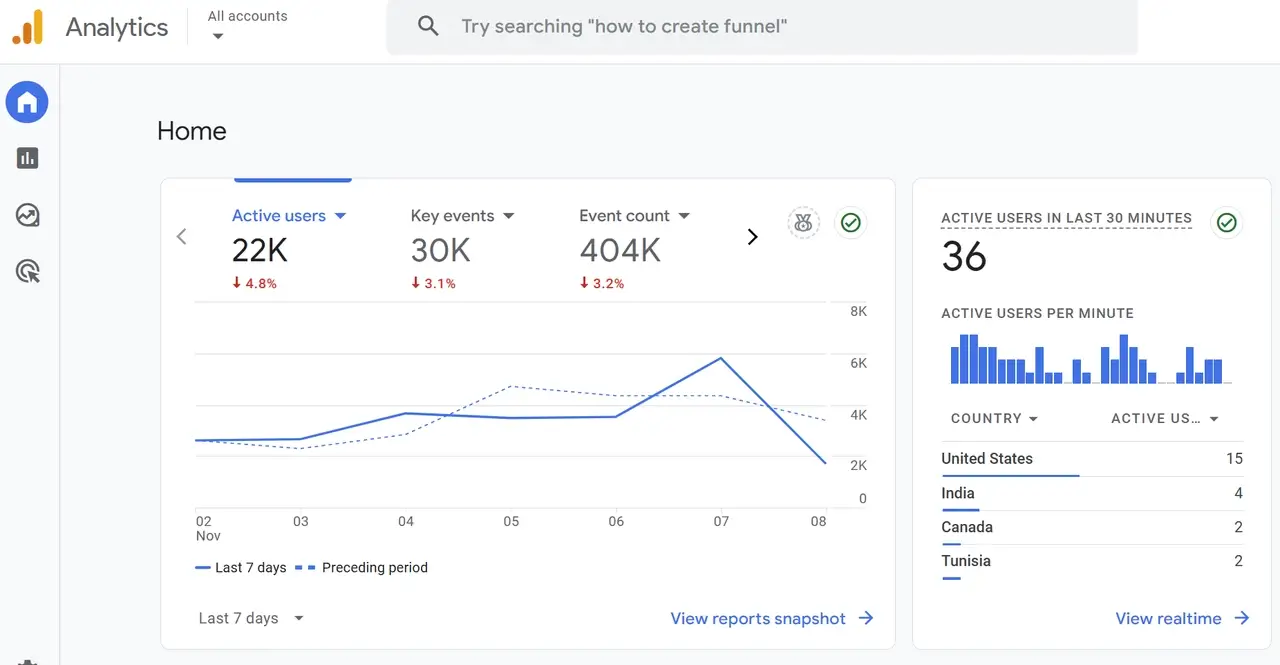
One of the foundational steps in setting up GA4 is selecting the right dimensions and metrics. Dimensions describe the attributes of your data (like location or device), while metrics are quantitative measurements (like session duration or conversion rate). The combination of well-chosen dimensions and metrics will help ensure your data is relevant, insightful, and aligned with your business goals.
| Step | Action |
|---|---|
| Identify Core Metrics | Select key metrics that align with your goals, such as conversion rate or page views. |
| Add Custom Dimensions | Track specific behaviors like device type, location, or traffic source. |
| Focus on Essentials | Avoid clutter—keep metrics relevant to make reports easier to interpret. |
Tip: Combining dimensions and metrics in Looker Studio can provide even deeper insights, helping align data organization with your GA4 strategy.
2. Set Up Custom Events for Greater Precision
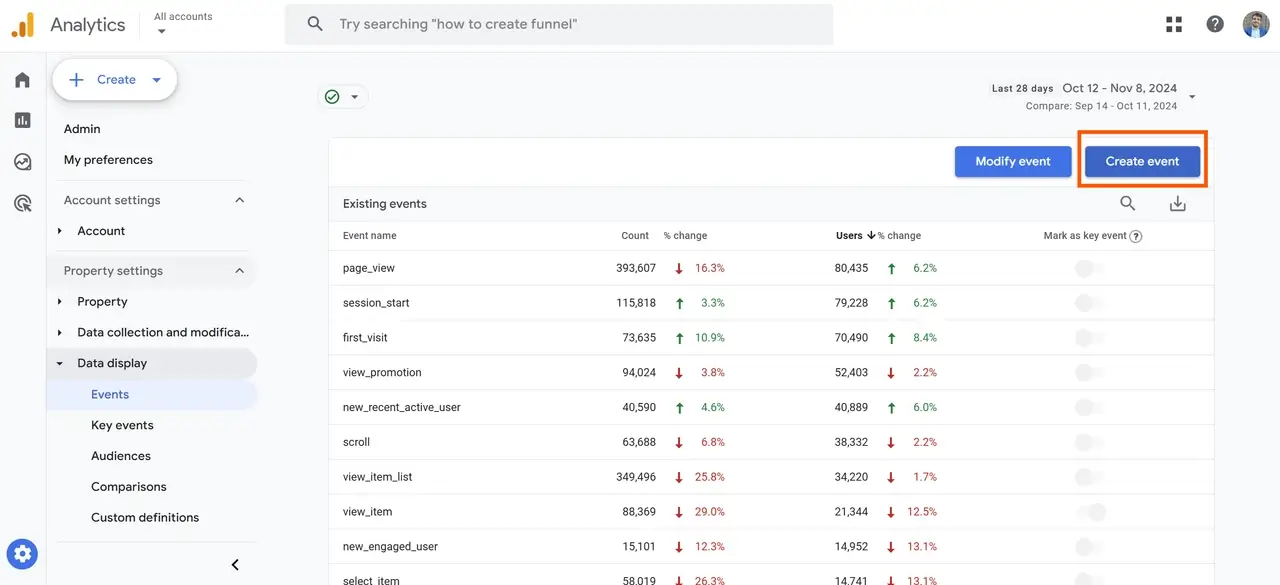
Custom events enable you to track unique user actions on your website or app that are crucial to your business goals but aren’t part of GA4’s default tracking. This level of customization allows you to capture data that’s tailored to your specific needs, providing deeper insight into user behavior.
Key Steps for Setting Up Custom Events
-
Define Key Actions
Identify the actions that are most valuable to your business. Examples:- User registrations
- File downloads
- CTA button clicks
-
Add Event Parameters
Enrich your custom events with additional details by adding parameters. For example:- Product category for items added to a cart
- Video duration watched for video content
| Custom Event | Event Parameter | Purpose |
|---|---|---|
| Form Submission | Form type (e.g., contact, signup) | Measure form effectiveness by type. |
| Video Play | Duration watched | Understand video engagement and completion rates. |
| Product Add to Cart | Product type or color | Track product preferences and inform inventory decisions. |
Example: Use the case in Looker Studio function to categorize events dynamically, enabling meaningful visualization in your reports.
3. Implement Custom Audiences
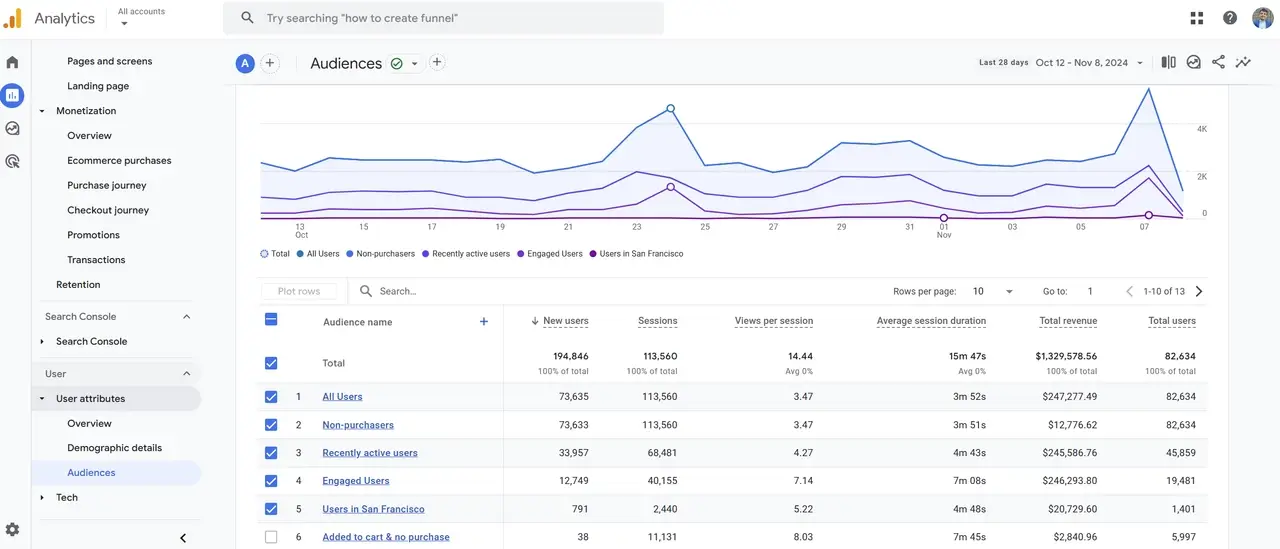
Segmenting users into custom audiences allows you to track and understand specific groups of visitors. By creating tailored audiences, you can see how different segments interact with your site and adjust your strategies to meet their needs more effectively.
Steps to Implement Custom Audiences
-
Create Behavioral Segments
Start by grouping users based on certain behaviors, such as:- Frequent visitors to a key product page
- Users who completed a purchase in the last 30 days
-
Build Remarketing Audiences
Identify users who are interested but haven’t converted, and re-engage them with targeted campaigns. Examples include:- Users who abandoned their carts
- Visitors who spent time on the pricing page
| Audience Type | Example Use |
|---|---|
| Frequent Visitors | See what content drives return traffic. |
| Engaged with Product Pages | Tailor ads for users who frequently visit product pages. |
| Abandoned Cart Users | Run retargeting campaigns to complete the purchase. |
4. Leverage GA4’s Explorations Tool
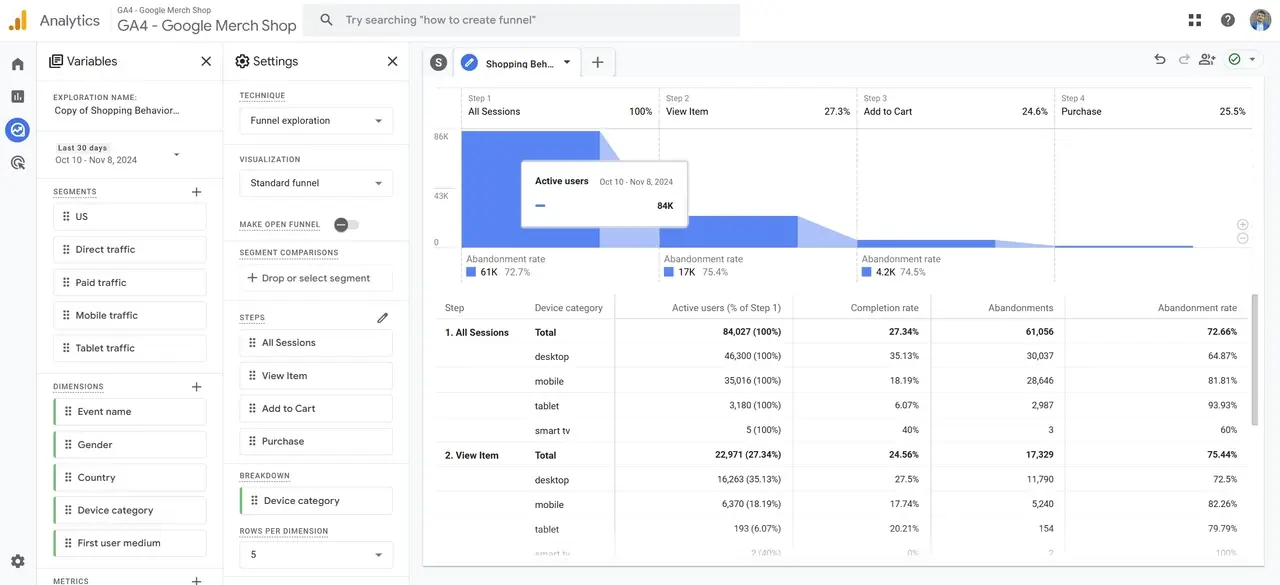
The Explorations tool is one of GA4’s most powerful features, offering an interactive interface where you can build custom reports and visualize complex data patterns. This tool allows you to go beyond standard reports to uncover detailed insights about user behavior and engagement.
Key Features of the Explorations Tool
| Feature | Use Case |
|---|---|
| Path Analysis | See user navigation paths and identify drop-off points. |
| Funnel Reports | Analyze each step in the conversion process. |
| Custom Segments | Apply filters to narrow down data for specific groups or actions. |
Example: If you notice a drop in conversions, use the Path Analysis feature to trace where users are dropping off. You may find that certain pages or interactions need improvement to retain users.
Quick Tip: Start with pre-set exploration templates available in GA4 for common analyses, like user journeys or conversion paths, to get valuable insights quickly.
5. Utilize Custom Dashboards and Templates
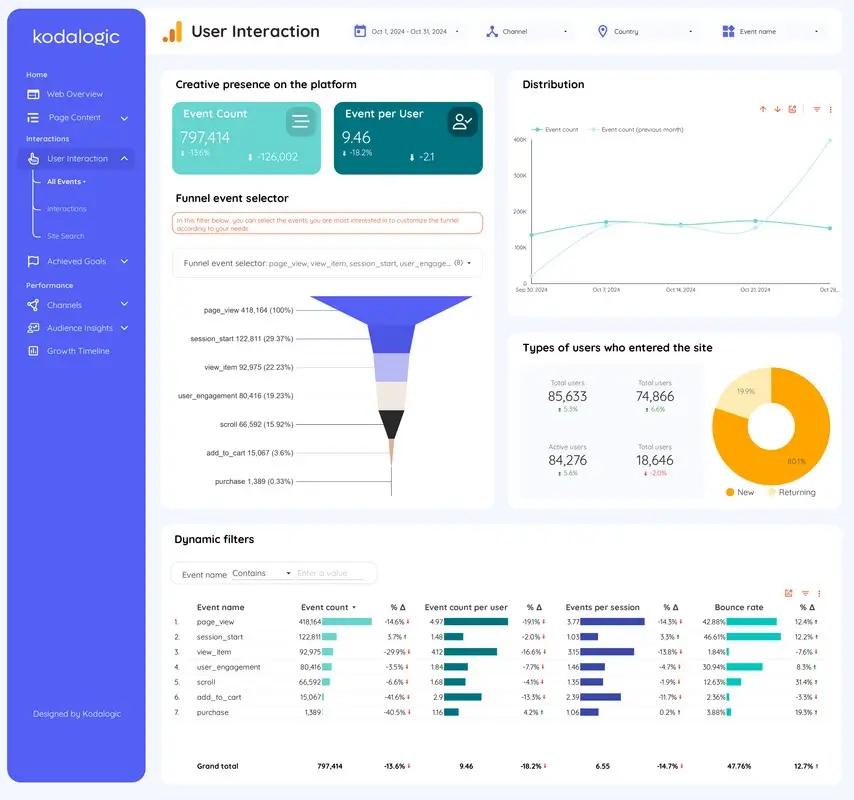
Creating custom dashboards in GA4 helps consolidate your most critical metrics in one place, enabling your team to monitor performance at a glance. Well-designed dashboards support quicker decision-making by keeping essential data visible and easy to understand.
Best Practices for Custom Dashboards
-
Focus on Key Metrics
Select only the metrics essential to your business goals, such as revenue, bounce rate, or session duration. This keeps your dashboard clean and relevant, making it easier to interpret at a glance. -
Use Pre-Made Templates
To save time and ensure consistent reporting across teams, consider using pre-made templates. These templates offer layouts and metrics pre-configured for typical business goals, allowing you to build a functional dashboard without starting from scratch.Kodalogic’s templates are designed from experience with hundreds of clients to be as comprehensive and efficient as possible. They come pre-built with the essential metrics and insights that help businesses reach their reporting goals quickly and accurately.
| Dashboard Feature | Benefits |
|---|---|
| Real-time Tracking | Instantly see metrics as they update, useful for live monitoring. |
| Consistent Metrics Across Teams | Align departments by using the same data structure. |
| Customizable Views | Easily adapt dashboard views to meet specific departmental needs. |
Tip: Set up a real-time data dashboard to track seasonal campaigns or high-traffic events, allowing your team to respond to trends as they happen.
For a quick start, explore Kodalogic’s Google Analytics for Looker Studio template, which includes pre-configured charts and popular metrics, simplifying your reporting process. This template supports use cases like GA4 Looker Studio templates, Google Data Studio templates, and customizable options for teams requiring specific metrics. Get started here: Kodalogic GA4 Template for Looker Studio.