10 of November of 2024
Agency Reporting Made Easy with Looker Dashboards

Isaac Correa
Looker Studio Templates
SEO & Marketing Dashboards
All your client data in one powerful dashboard—made for digital agencies that value clarity and time.
Single Dashboard for All Your Clients: Data Visualization and Management in Looker Studio for Agencies
If you’re managing reports for multiple clients and need an efficient way to send them personalized, data-driven updates, this guide is for you. With Looker Studio and Kodalogic’s templates, agencies can create a unique, branded dashboard for each client that’s fully automated and easy to set up in minutes.
We’ll explore how to create a standardized dashboard you can duplicate, customize, and automate to send weekly, monthly, or quarterly reports by email—no complex data imports or Google Sheets required.
1. What is a Multi-Client Dashboard?
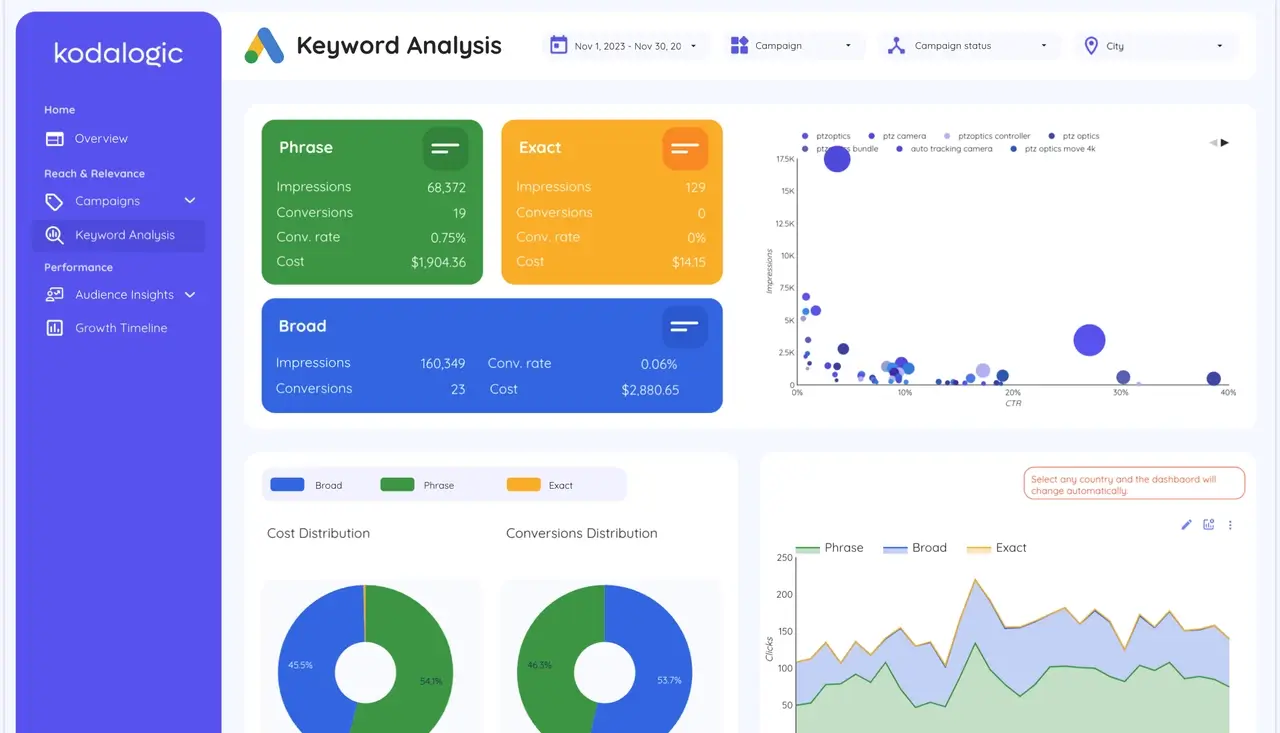
A Multi-Client Dashboard is a pre-designed template in Looker Studio that centralizes the data each client needs to see, from ad campaign performance to SEO metrics. With a single dashboard design, agencies can duplicate and personalize a report for each client, saving hours on report preparation while offering clients a professional, branded experience.
Key Benefits:
- Time-Saving: Design once, then duplicate in seconds for each client.
- Consistent Look and Feel: A uniform, professional layout across all client reports.
- Full Automation: Connects directly to data sources for real-time insights without extra data imports.
Who Benefits from this Setup?
This solution is ideal for agencies managing:
- PPC Campaigns: Track and report on impressions, clicks, conversions, and ROI.
- SEO Performance: Share data like organic reach, clicks, keyword rankings, and trends.
2. Essential Elements: Key Metrics to Include
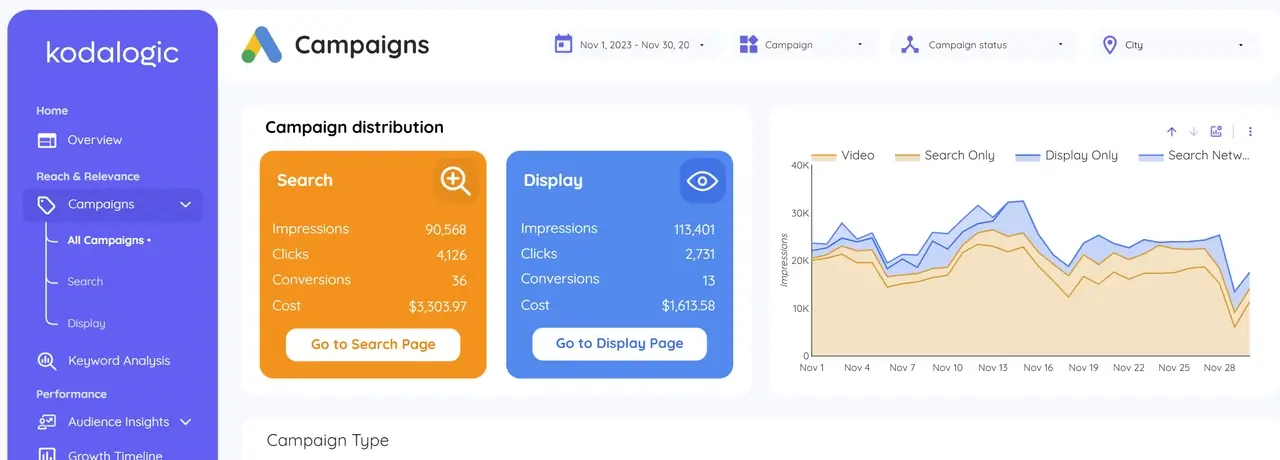
For a dashboard to work seamlessly across multiple clients, it’s essential to select metrics that clearly show performance against each client’s objectives. Kodalogic’s templates include key metrics presented in an easy-to-read format, perfect for clients with little to no technical expertise.
| Metric | Description |
|---|---|
| Impressions | Measures visibility across platforms, showing how many people saw the ad. |
| Clicks | Indicates the level of interaction with the ad content. |
| Conversions | Tracks specific actions taken that align with campaign goals. |
| ROI | Calculates the return on investment to gauge campaign profitability. |
Tip: Each section is organized to provide ample space for each key metric, so every duplicate dashboard maintains a professional, easy-to-read structure.
3. Setting Up a Base Dashboard in Looker Studio
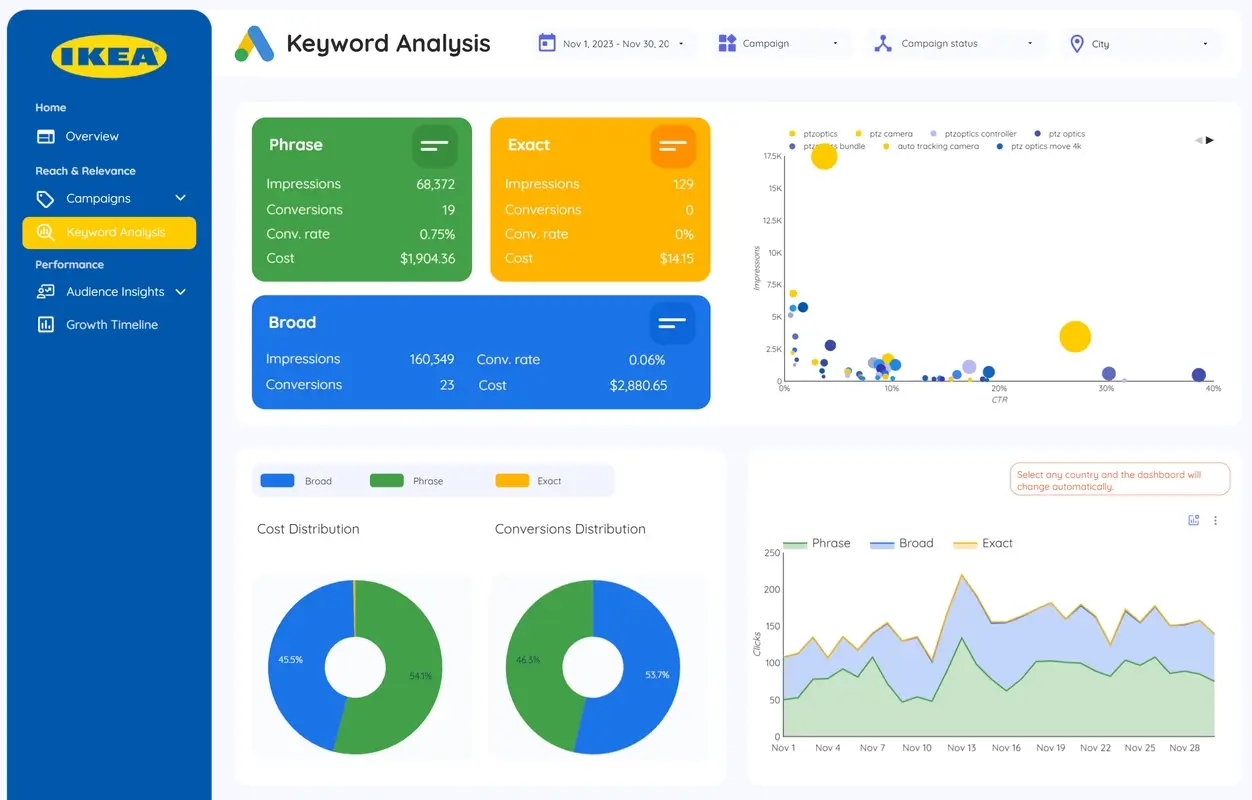
To create a base dashboard ready for easy customization and client branding, start with a Kodalogic template for Looker Studio:
- Choose Base Colors: Use neutral or agency-branded colors that can be quickly adjusted.
- Organize Metrics by Section: Separate key metrics like reach, engagement, and conversions into clearly defined sections.
- Add a Placeholder for Client Branding: Templates from Kodalogic include space for client logos, making personalization quick and easy.
Tip: Save this base dashboard as a reusable template so each new client report setup takes just a few seconds.
4. Easy Customization of Colors and Logos
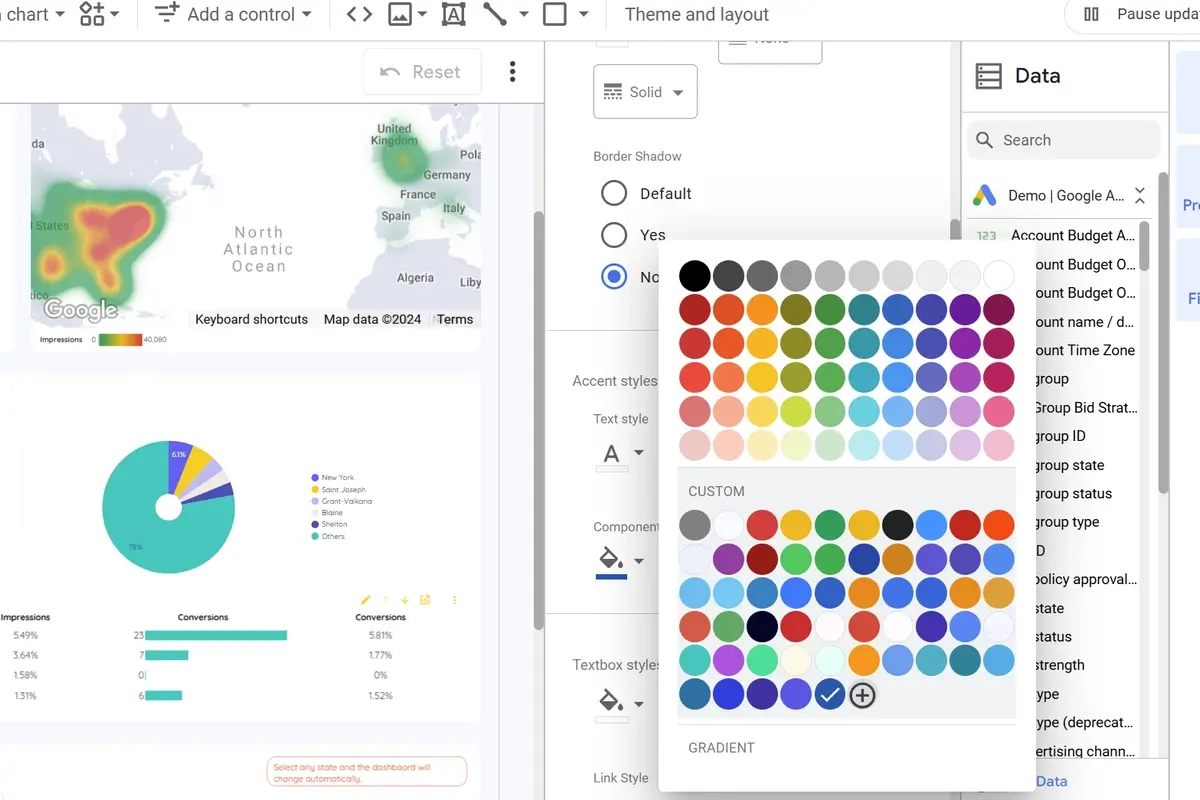
Personalizing your dashboard for each client is simple—Kodalogic’s template design allows you to change colors and logos with just three clicks, giving each report a unique look that aligns with the client’s brand.
Steps to Customize Colors and Logos:
- Duplicate the Base Dashboard: Use Looker Studio’s “Make a copy” feature to create a unique report for each client.
- Connect to Client-Specific Data: Select the client’s data source—no manual data imports needed.
- Personalize Colors and Logos: Update the color scheme and insert the client’s logo. This seamless customization keeps each report professional and on-brand.
Tip: Customization enhances the client experience and builds stronger relationships by providing data that’s not only easy to interpret but also visually appealing.
5. Automating Report Delivery by Email
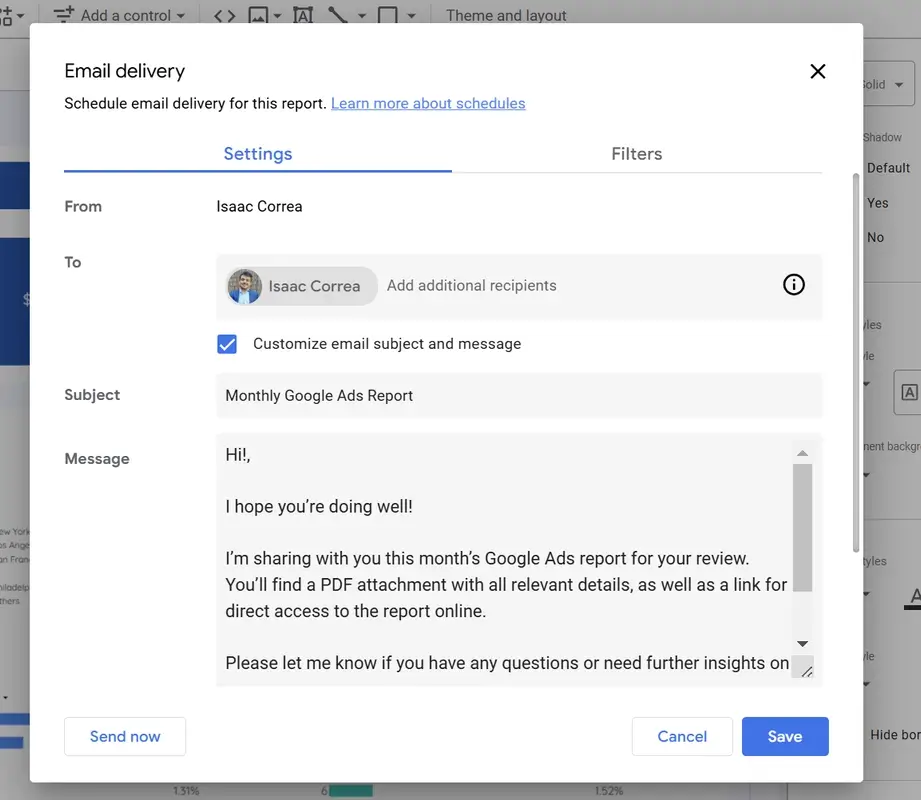
Looker Studio allows you to schedule email reports, ensuring each client receives performance updates automatically. Choose to send reports weekly, monthly, or quarterly, giving clients consistent, timely access to their performance data.
Setting Up Scheduled Email Reports:
- Click “Share” on the top right of the dashboard.
- Select “Schedule email delivery” and choose the preferred frequency (weekly, monthly, or quarterly).
- Customize the Email Subject and Message to clarify the report’s contents.
- Add Client Contacts as recipients, so all relevant stakeholders receive the report.
Tip: Automated delivery saves time and keeps clients informed with up-to-date performance data without manual effort.
6. Kodalogic’s Intuitive, Ready-to-Use Templates
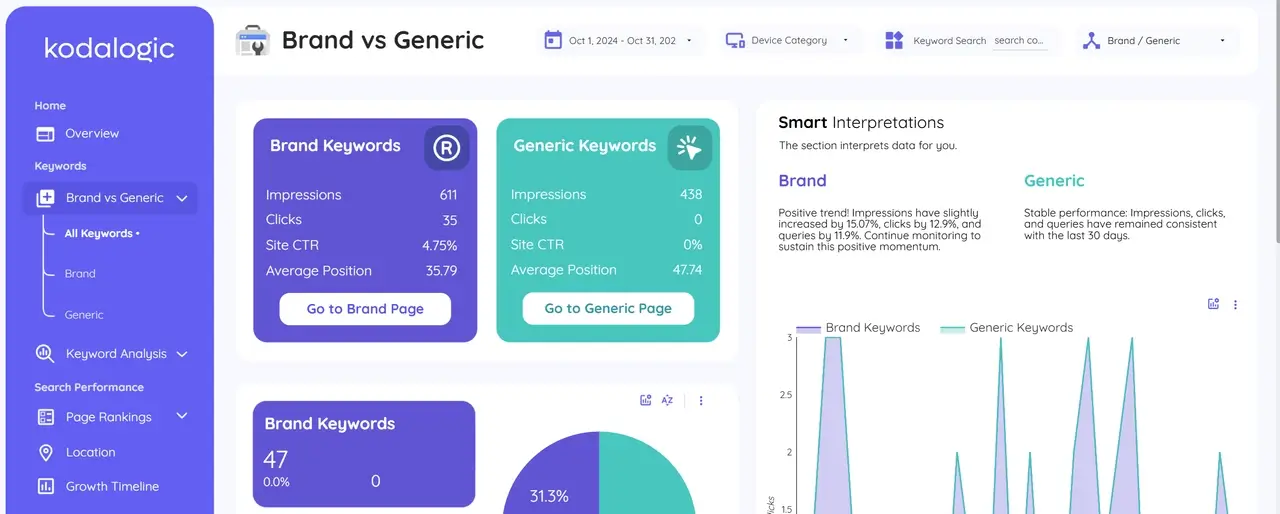
Kodalogic’s Looker Studio templates are designed to make reporting flexible and user-friendly for agencies. With Smart Interpretations, Kodalogic templates go beyond displaying data—they provide text summaries that explain key data trends, helping clients understand their performance in every area.
Key Features of Kodalogic Templates:
- User-Friendly Design: Intuitively structured to make data easy to understand.
- Smart Interpretations: Text-based summaries provide clear, digestible insights.
- Quick Report Creation: In less than a minute, create a customized report for each client. Simply enter the client’s identifier—no logins or passwords required.
Support Made Easy: Kodalogic is one of the few companies offering quick duplication without complex logins. As a template owner, you have access to a panel where, by entering your client’s identifier, a complete report is generated in seconds.
Ready to simplify client management? Discover Kodalogic’s Looker Studio templates to create a unique dashboard for all your clients, personalize it with colors and logos, and schedule automated email reports. Save time, improve efficiency, and deliver a superior client experience with Kodalogic.