01 of May of 2025
Automated SEO Reports for Clients in Data Studio

Isaac Correa
Looker Studio Templates
SEO & Marketing Dashboards
Automate SEO reporting with Looker Studio, GA4, and GSC. Save time and get real-time dashboards sent straight to your inbox.
An automated SEO report is a report that rebuilds itself. The numbers come out of Google every time somebody opens it, and the file arrives in an inbox on the day it is supposed to arrive. Nobody exports anything, nobody pastes anything, and the version a client reads on Tuesday is the same one their account manager reads on Tuesday.
That is what our Web & SEO Performance Dashboard does: 27 pages built on Data Studio (formerly Looker Studio), connected to your own Google Analytics 4 property and your own Search Console property at the same time, for $214 paid once.
If you report on one site, that is one task off the month. If you report on nine, it is the arithmetic that decides this page: the rebuilding recurs every month and per client, the price does not. The report is copied once per client and paid for once in total. You know your own rate; the comparison is between a number you pay once and a job that comes back.
This page is about what the report does on its own, week after week, once it is connected. Every screen below is the report running live, and the whole thing opens in a demo with no account and nothing to sign, so you can click the same pages while you read.
What automated SEO reporting actually automates
Three different jobs hide inside the phrase automated SEO reporting, and a tool that does one of them is often sold as if it did all three.
The first is collecting the data. Google already does this, for free, in Search Console and Analytics. Nothing needs automating here: the numbers exist whether anybody looks or not.
The second is arranging it. This is the one that eats the time: deciding which sections a report needs, splitting branded queries from generic ones, grouping keywords by length, sorting pages by what they earned rather than what they got. Done by hand in a spreadsheet, it is the same work every month, on new numbers.
The third is sending it. A report nobody opens has not been delivered.
Automated reporting means the second and the third stop being work. The template is the arrangement, already made. The schedule is the delivery, already set. What is left for a person is the only part worth a person: reading it and deciding what to do.
The size of the second job is the reason this page exists. Swydo, who sell a competing reporting tool and so have no reason to make the number look big, put it at five hours per client per month: on a roster of ten clients that is fifty hours a month spent rebuilding the same report on new numbers, a figure that is in the sources below. Against that, a template is bought once and copied per client.
The 27 pages, in two halves
The report has two data sources, and you pick between them at the top of the left rail. That is the whole shape of it.
| half | source | what it answers |
|---|---|---|
| Search performance | Search Console | What the site appears for in Google, at what position, and which way each query moved |
| Site behaviour | Google Analytics 4 | What the people who arrived actually did: where they landed, how long they stayed, what they completed |
Most SEO reports are one half. Rank trackers give you positions and stop at the click; analytics dashboards start at the click and cannot tell you what was searched. The reason both live in one file here is that neither half answers a client's real question on its own, which is not "where do we rank" but "is any of this working".
The Search Console half: rankings, the brand split and the position bands
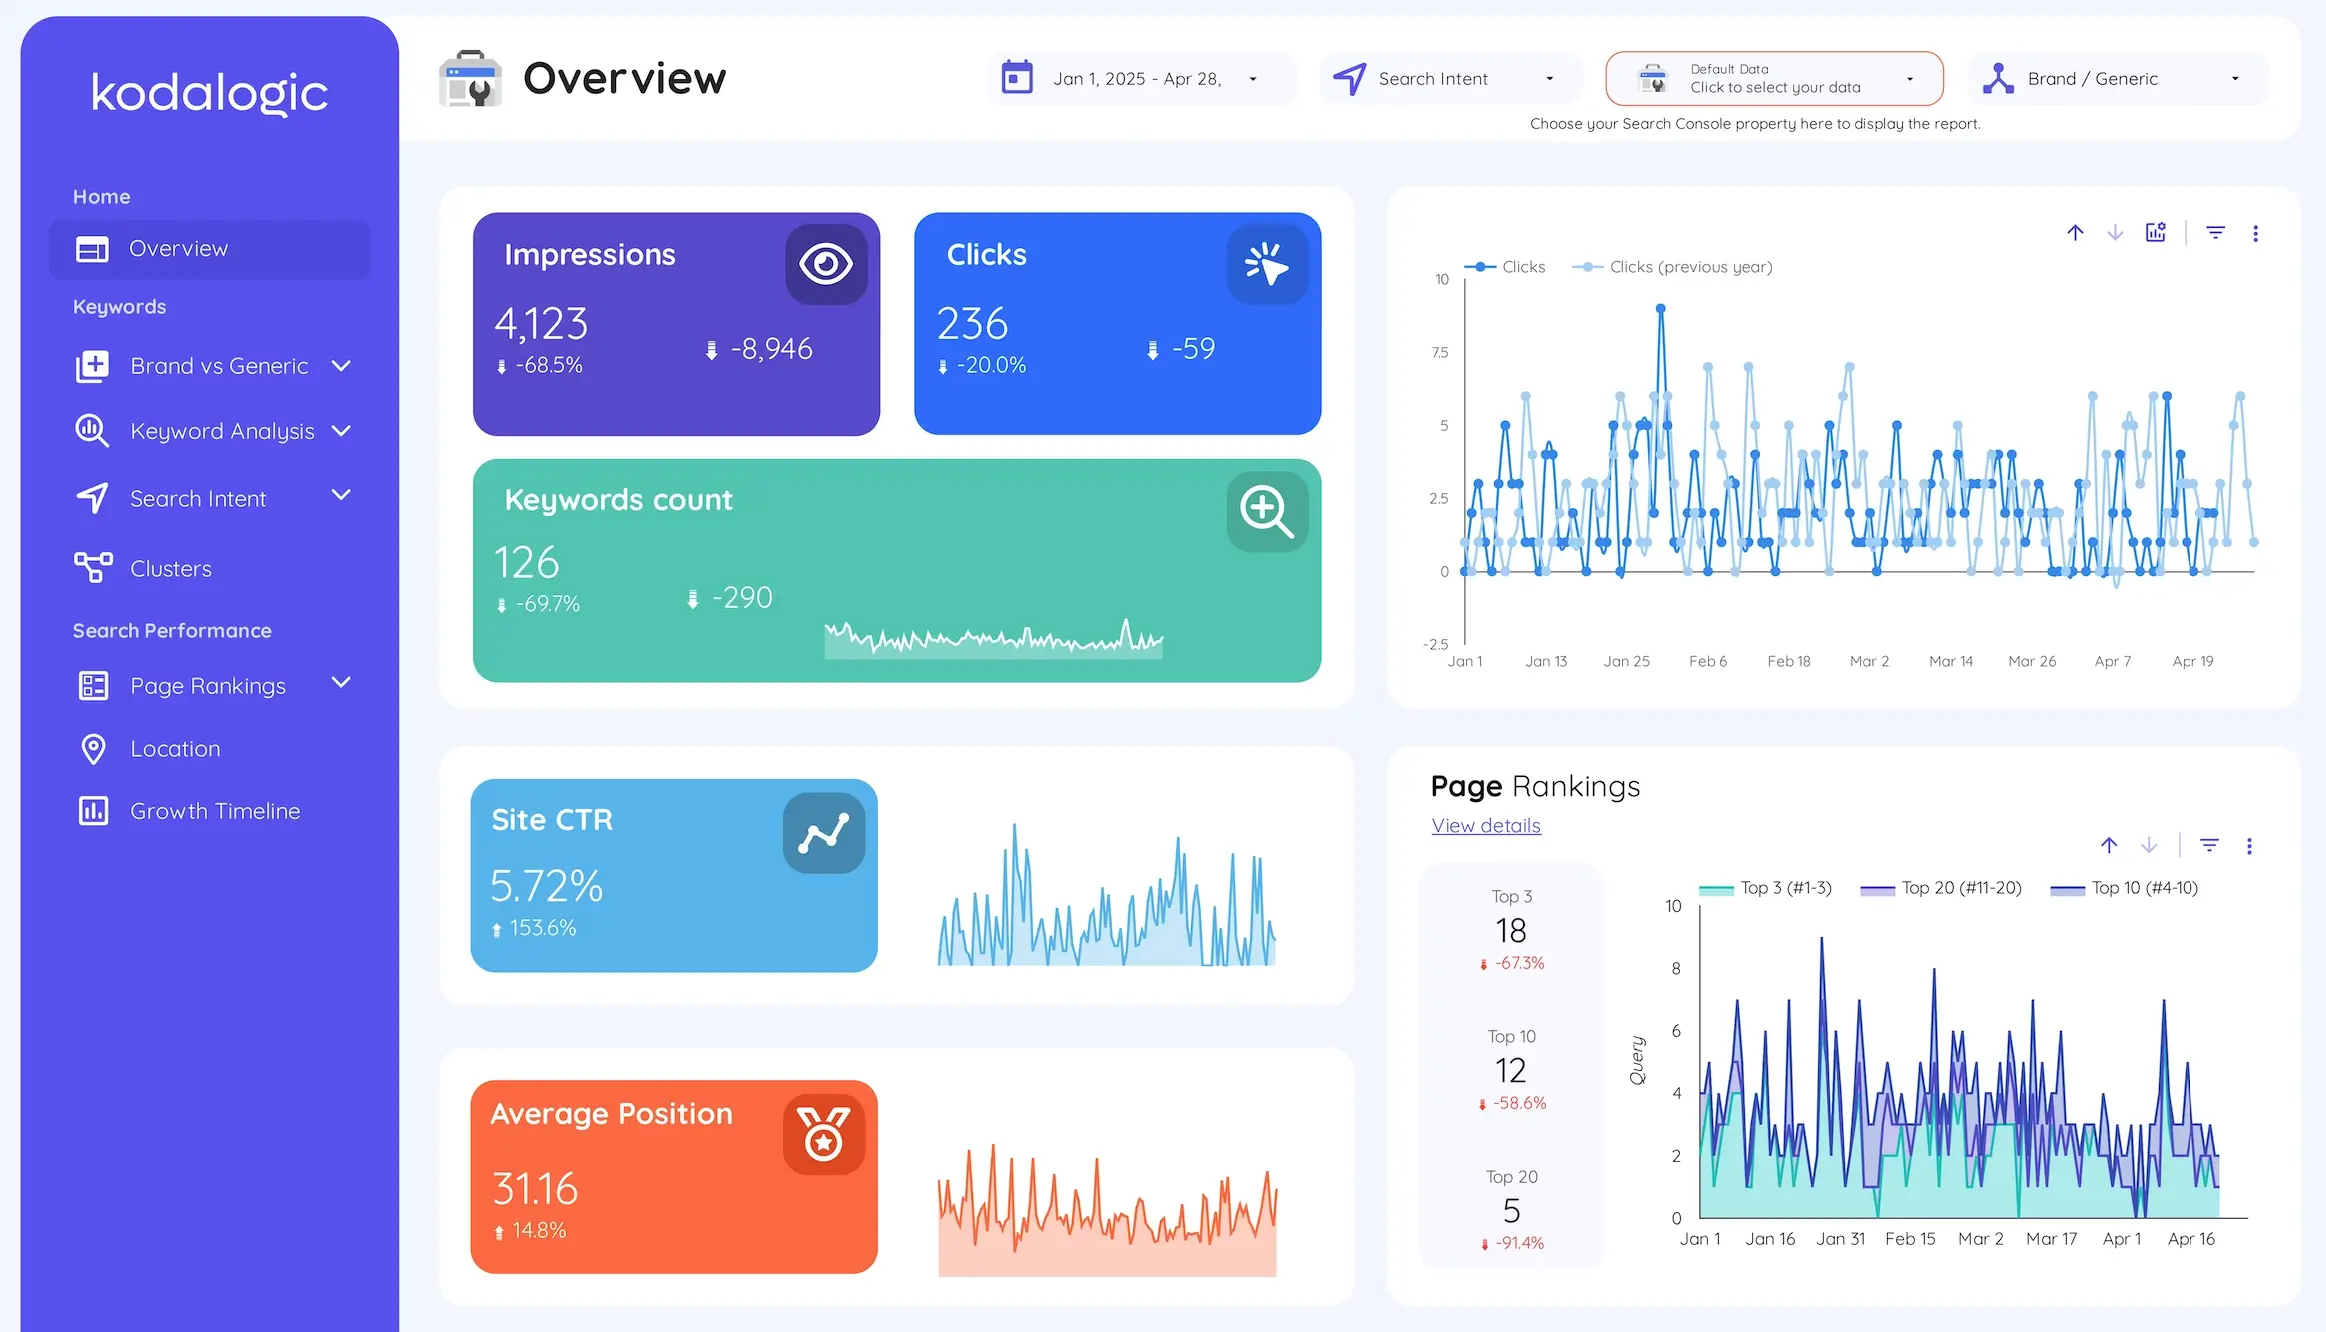
The search side of the report is the same module as our keyword ranking report, and it opens on an overview: impressions, clicks, click-through rate, average position and the count of keywords the site ranked for, each with its change against the previous period, plus a panel that carries three of the four position bands: how many keywords sit in the top three, the top ten and the top twenty.
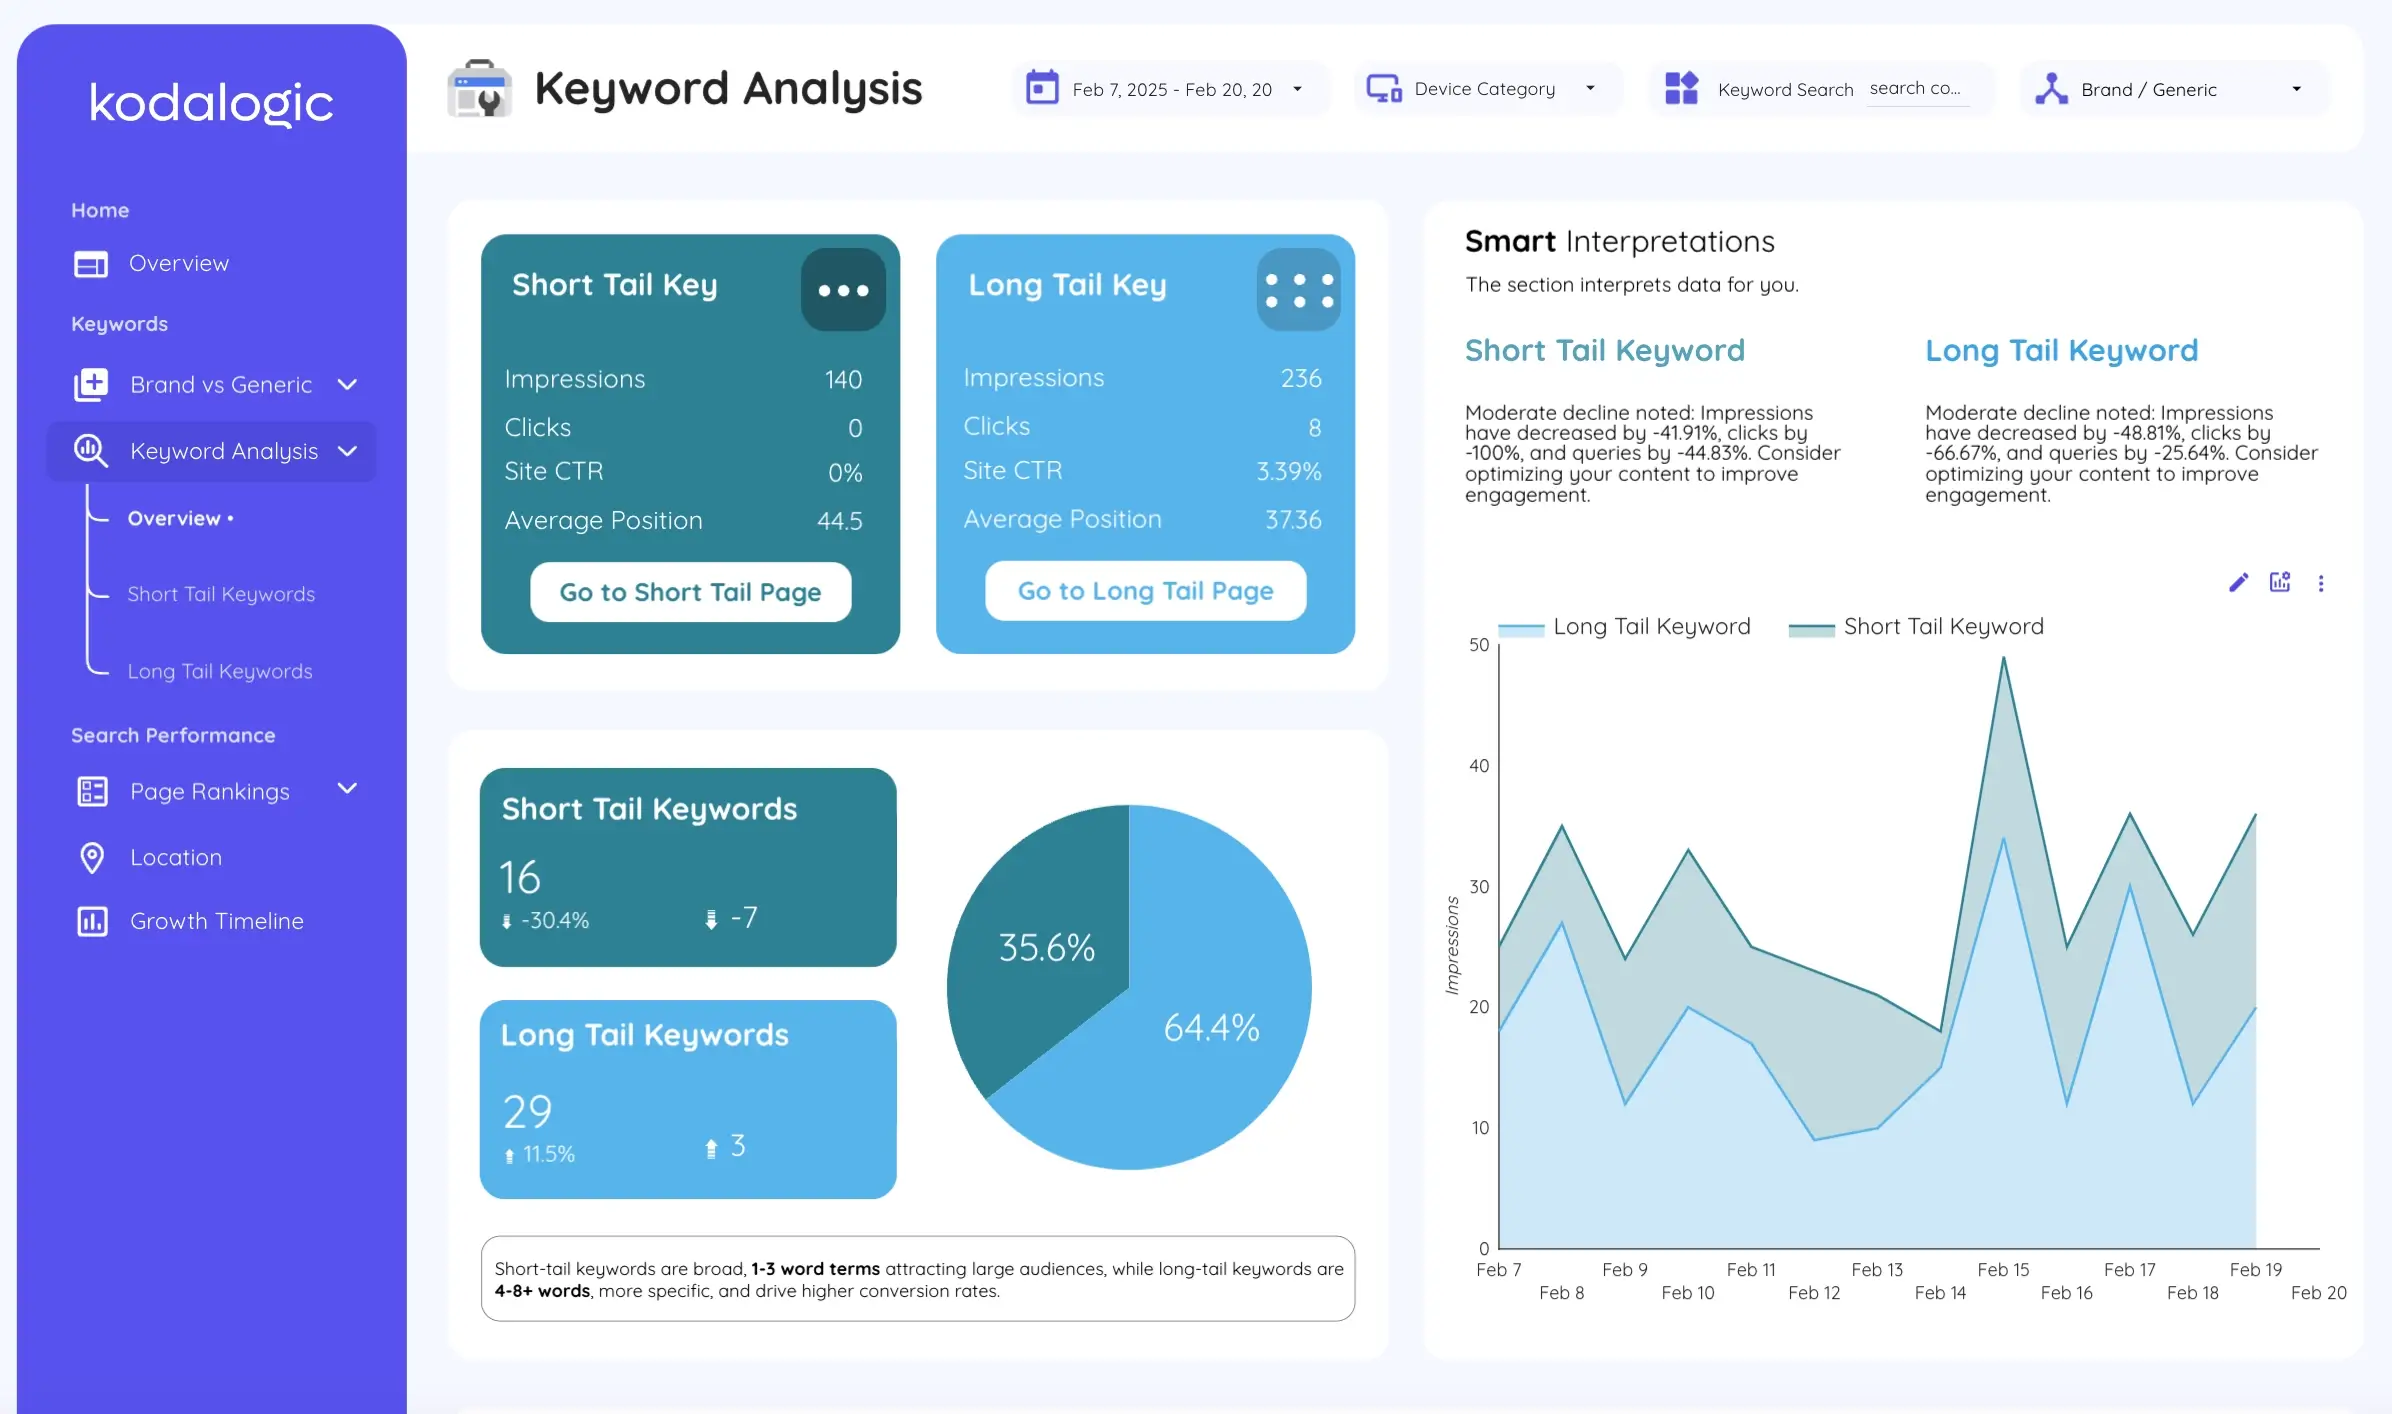
Underneath it, the pages that do the actual sorting. Brand against generic, which separates the people who searched for the company by name from the people who found it for the problem it solves, and which are two different results for two different teams. Position bands, which replace one average with four counts, the three above plus everything from position 21 down, because an average in the thirties can be six queries on page one and forty far behind it, or everything sitting flatly in the middle. And the movers, which put each query's position now next to its position last quarter and sort by the difference.
One pattern is worth looking for on every one of these pages, because it is the cheapest work in SEO: queries with many impressions and almost no clicks. A query that Google shows thousands of times and nobody clicks is a page that is already visible and failing at the last step, and the fix is a title and a description rather than an article. The tables put impressions, click-through rate and position in the same row precisely so that those queries stand out without anybody building a filter.
There is also a page that splits the table by how much the person typed, and a filter row that runs across the top of every page of this half: the date range with its comparison period, device, a keyword search box and the brand filter. Pick a fortnight or a device once and the page you are on obeys it.
The GA4 half: what happens after the organic click
This is the half that a rank tracker cannot give you, and the one that changes what a client takes away from the meeting.
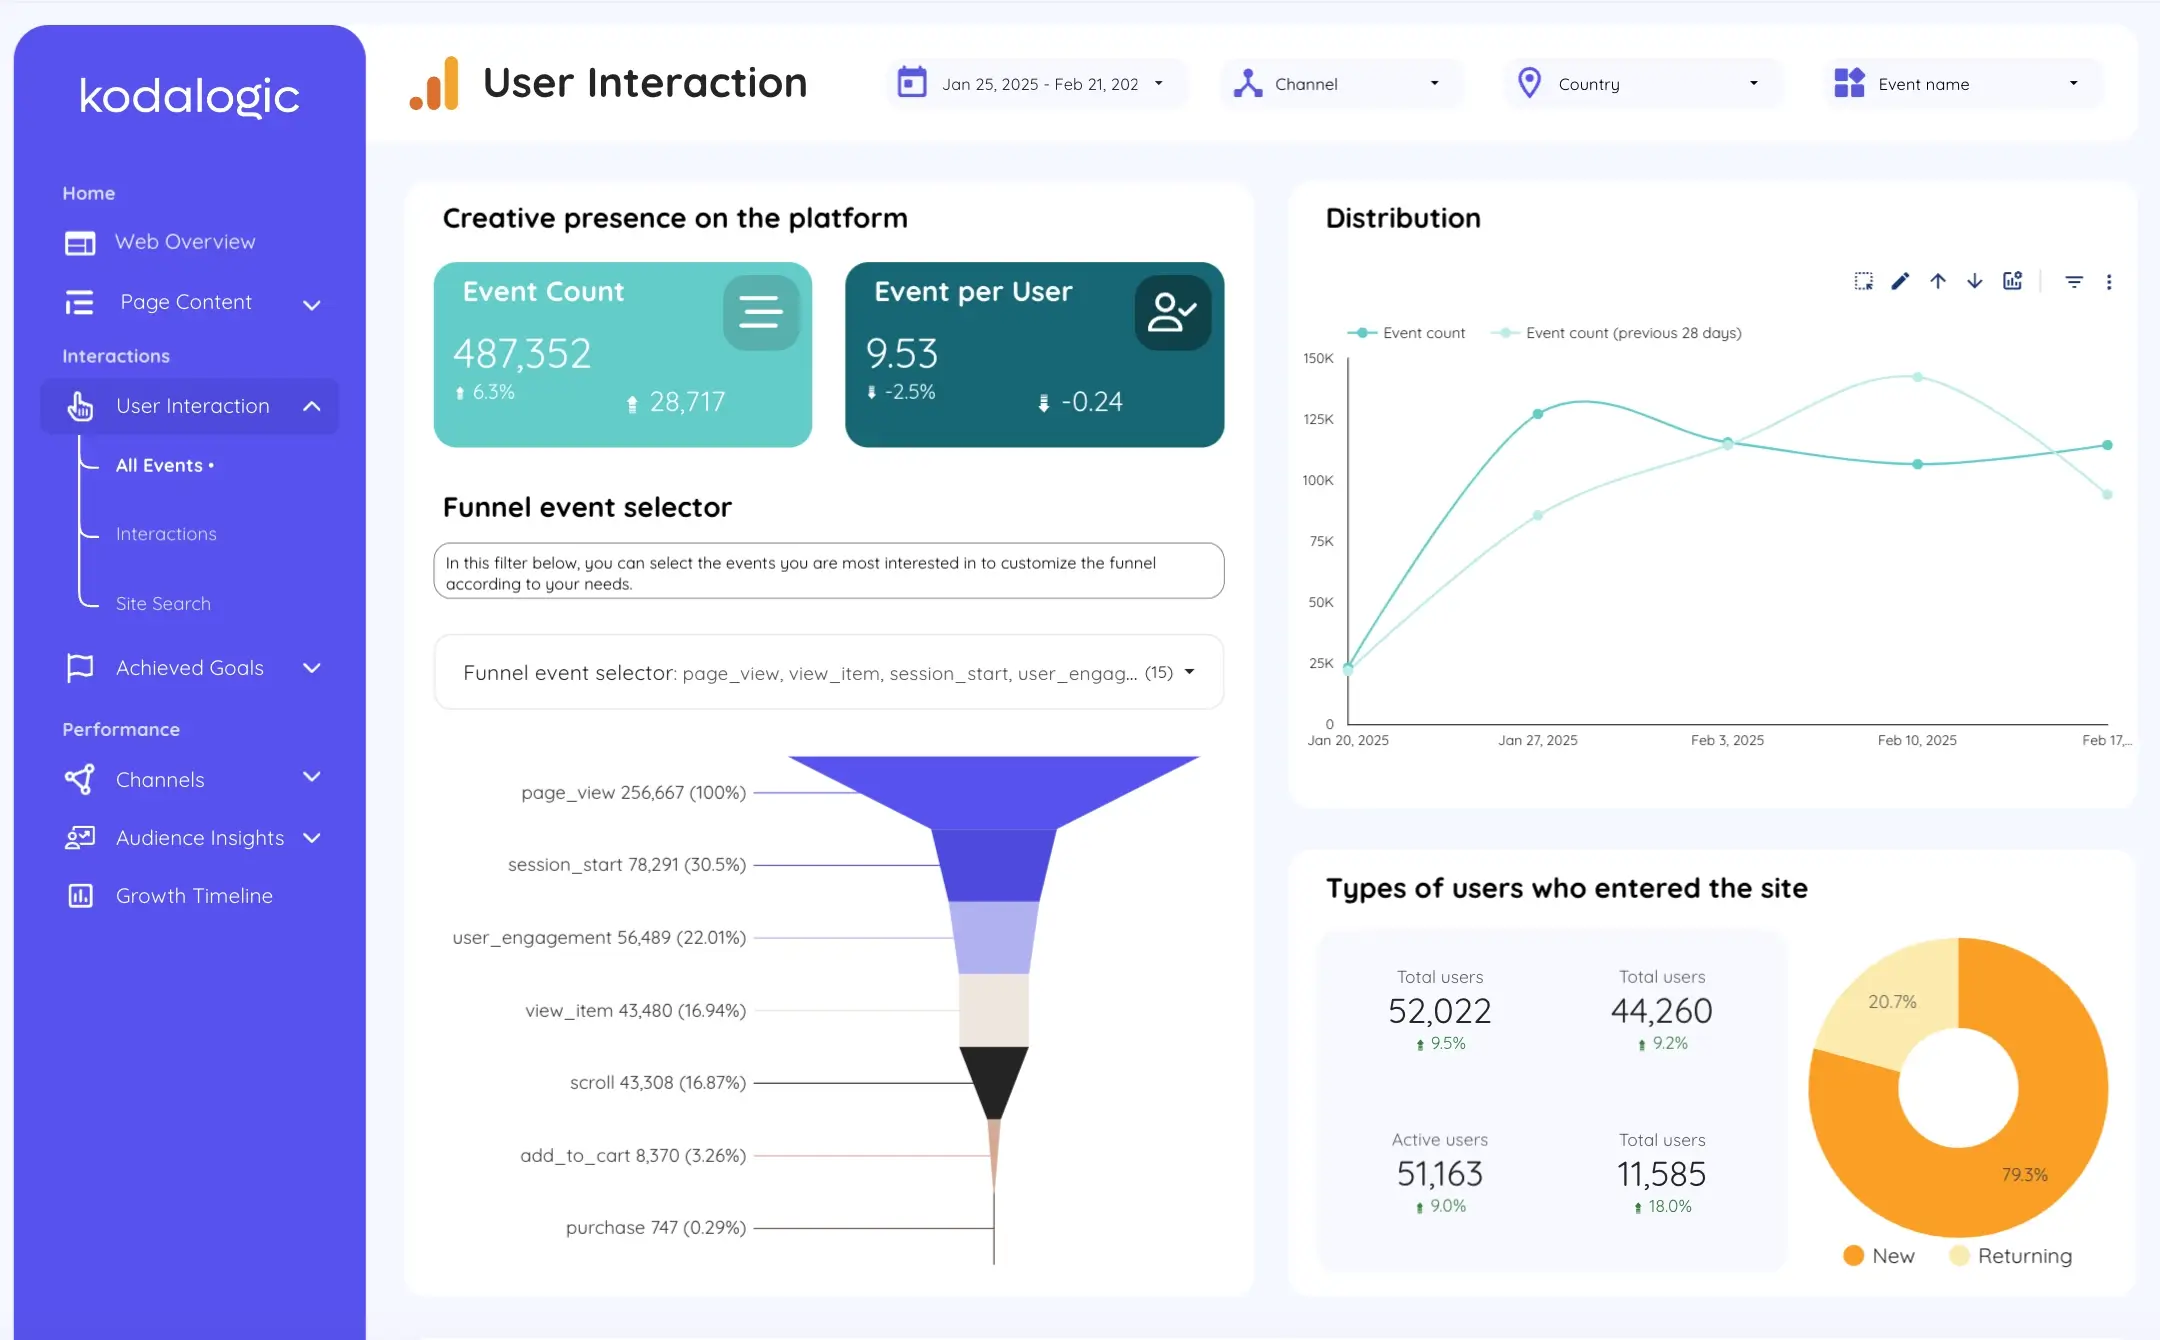
The pages here answer the questions that come immediately after a ranking improves. Which pages people landed on, and which of those held them. How engaged the sessions were rather than how many there were. Which goals were completed. Who the audience was, and where they came from.
Put beside the search half, this is what turns a position into an argument. A keyword that climbed to page one and brings people who leave in four seconds is not a win, and it takes both halves of the report to see that in one sitting instead of two.
Channels: organic on its own, next to everything else
One page deserves its own mention, because it is the one that settles arguments about budget.
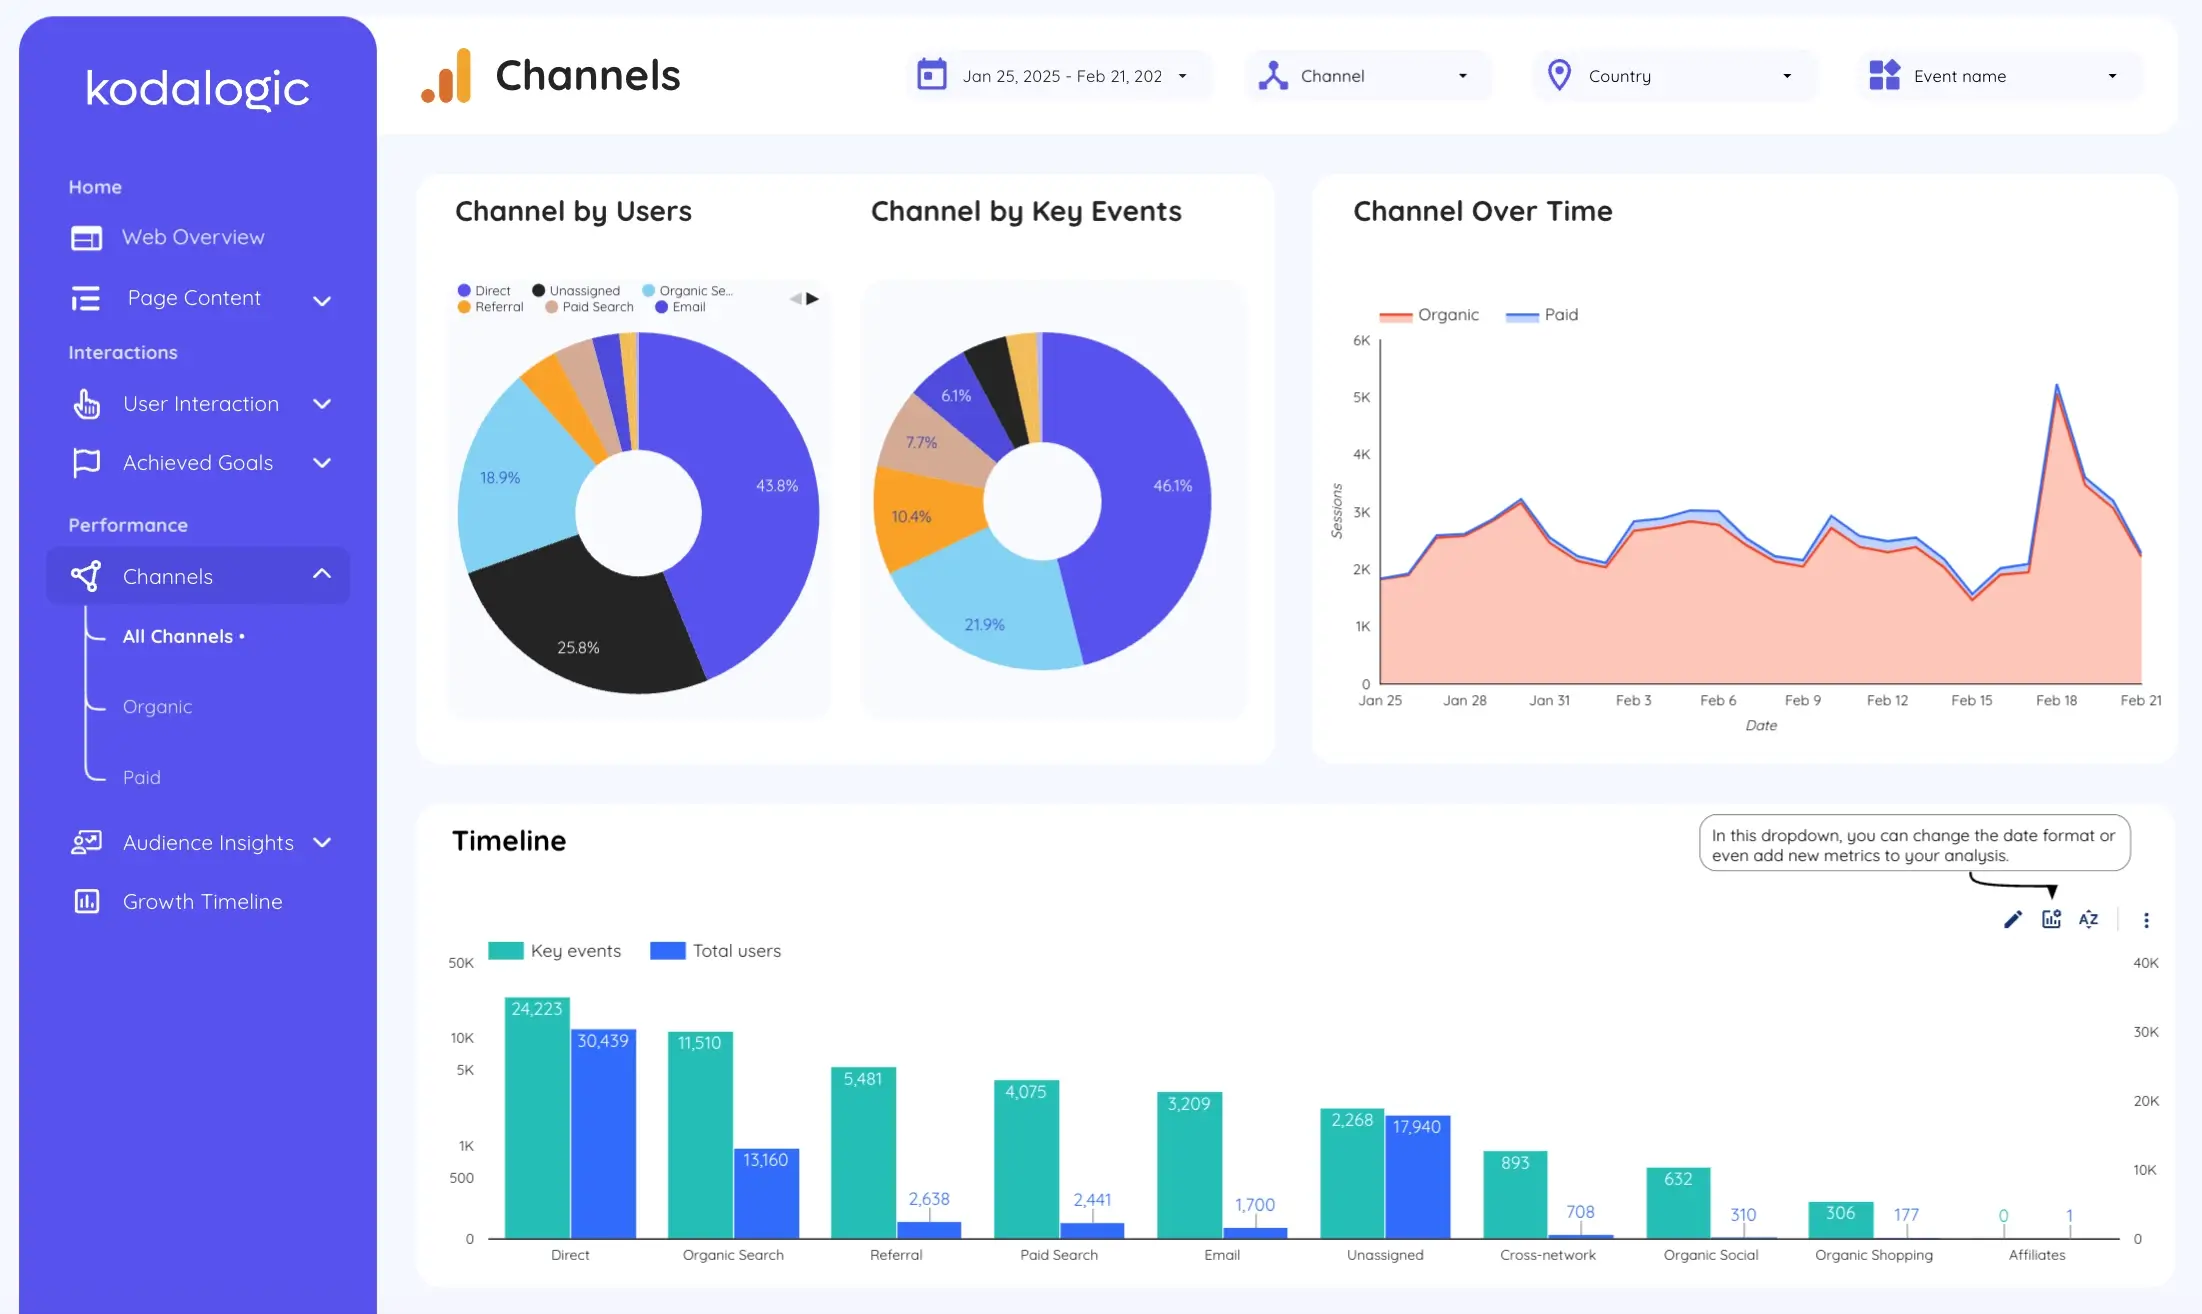
It carries the split of users by channel and the split of key events by channel as two circles side by side, an organic against paid line over the period, and a timeline that puts key events next to total users for each channel in turn. Organic also gets its own sub-page, and so does paid.
The value of seeing them together is the comparison nobody makes on purpose: a channel can bring a third of the visitors and almost none of the completions, or the reverse, and the two circles show that in about a second.
How the report explains itself on arrival
Every refresh, the report reads its own period and writes the direction in plain language: stable, improving or declining, on the pages where that judgment is useful. It is the report describing its own numbers, not an opinion about them, and it is the part a client actually reads before they look at a single chart.
That matters more in an automated report than anywhere else, because nobody is standing next to it when it arrives. A report that leaves on a schedule has to explain itself on arrival or it does not get read. What Smart Interpretations is, and what it does not do, has its own page.
Scheduling: the part that makes the report automatic
A live report is not yet an automated report. The link updates itself, which solves the arranging, but somebody still has to remember it exists.
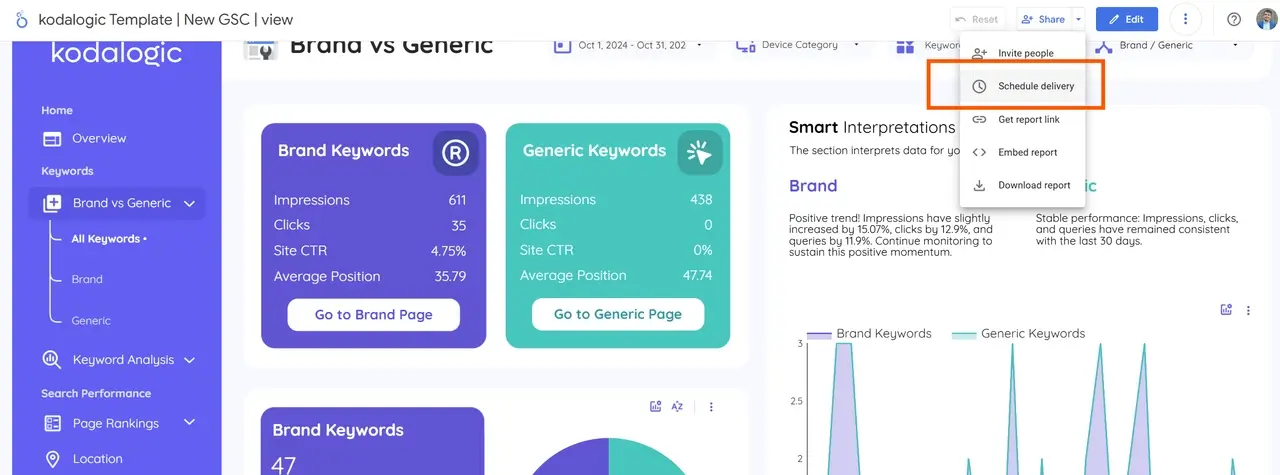
Data Studio sends the report by email on the cadence you set, to the people you list, with the pages rendered as they stand that morning. One caveat worth knowing before the first send: Google marks the newest Search Console data as preliminary and says it may still change in the following hours, so a report that leaves very early can differ slightly from the same report opened at noon. Set it once per client.
Our guide to scheduling a report by email covers it step by step, because the procedure is the same for any Data Studio report and not just for ours.
What happens on your property on day one
Four things happen once, and then nothing happens again.
From payment to a report that sends itself
- 1
Copy the report
The link arrives right after checkout with the setup guide beside it. One click makes a copy of all 27 pages inside your own Google account, where it becomes an ordinary Data Studio file that belongs to you.
- 2
Point it at both properties
Pick your Google Analytics 4 property and your Search Console property from the selectors at the top. Both halves fill with your own numbers, with no connector to install and no extra account to create.
- 3
Type your brand names
The one thing the report cannot know on its own: your company name, its misspellings, your product names. From that moment the branded and generic sides of the search half tell two separate stories.
- 4
Set the schedule and send it
Your logo, your colours, your fonts, and then the recipients and the frequency. After that the report leaves on its own and you only open it when you want to read it.
A report built by hand, and the same report automated
The monthly export
- Two exports, from two tools, joined in a spreadsheet
- The same layout decisions remade every month, on new numbers
- Branded and generic mixed, unless somebody filters them by hand
- Rankings in one file and behaviour in another, compared from memory
- Sent when whoever builds it has finished building it
The Web & SEO report
- Both sources in one file, joined once and kept joined
- 27 pages already laid out, recalculated on open
- Brand and generic apart from the moment you type your brand names
- Search performance and site behaviour in the same report, same period
- Sent on the schedule the client expects, with the reading already written
What it costs, and what comes with it
The template is $214, paid once. It covers both sources, which is the reason it exists: the single-source templates are $129 each, the Search Console one and the Analytics one, so the two of them separately come to $258. This one is $44 less and already has them joined. If the reporting also has to cover paid, the all-in-one dashboard adds Google Ads to these same two sources.
Two things come with it that usually are not included. Updates for life at no extra cost, so a page added next year arrives in your copy too. And support by email until the report is running on your own properties, which is the day something goes wrong if it is going to: a property verified the wrong way, a data source that will not connect, a brand list that catches more than it should.
Kodalogic builds dashboards to order as well as selling them ready-made, and the three numbers below come from the reviews page, which lists every one of them and where it was left. They say nothing about this template directly, and everything about the people who built it.
4.97
Average rating
out of 5, on Fiverr
16
Reviewed more than once
the same buyer, coming back
27
Countries
where the reviewers wrote from
The middle number is the one to read. A rating says the job was done; people ordering again say it was done well enough to repeat. One of them puts it in a line: "Kodalogic are true professionals and I highly recommend them for your Looker Studio dashboards, reporting and data visualization needs." They are all on the reviews page, every one.
The no-refund clause is in the terms, section five, in the same words. The SEO report, page by page, is on its own page, and the template itself is here.
Why this instead of a reporting tool with a monthly fee
There are good dedicated platforms for agency reporting, and for a shop juggling a dozen ad platforms and a dozen clients they earn their subscription. This is not that. It is narrower on purpose.
The narrowness is the argument. Most SEO reporting sits on two sources, Search Console and Analytics, and both are Google's own, free, and connected natively by Data Studio. A subscription that resells access to data you already own has to justify itself on the arrangement alone, every month, forever. A template charges for the arrangement once.
Where a subscription wins: many platforms at once, white labelling at scale, and client portals. Where this wins: you own the file, nothing expires, and the report does not stop working if a renewal lapses.
What an automated SEO report cannot do
Automation moves the work; it does not remove the thinking. Three things are worth knowing before you send the first one.
The first is inside the data. Every position in the search half is an impression-weighted average, because that is how Google reports it, so a query filed in a band is a band of averages. Something that spent half a month at position 2 and half at 38 lands in the top twenty with an average of 20, and nothing in Search Console shows it was never actually there.
The second is a gap the report cannot close. Per-query clicks never add up to total clicks: Google withholds a query from the table when too few people searched it, and counts its clicks in the total anyway. Every rate in the search half describes the itemised table rather than the whole site, which is worth saying in a client report before somebody notices and asks.
The third is about the two halves. Search Console counts what happened in Google and GA4 counts what happened on the site, and they are measured differently by different systems: a click counted when somebody leaves Google and a session counted when somebody arrives on the site are different events, counted by different systems, and they do not have to match. The report puts them in one file and side by side on purpose, and it does not pretend they reconcile to the unit.
And one thing it does not cover at all. It reports only on properties you own, so a competitor's position is a question for a rank tracker, which is a subscription per client. For everything on the 27 pages above, it is a second copy of numbers Google already gives you for free.
None of that is a reason to build the report by hand instead. It is the list of things to know while you read it.
Frequently asked questions
What is an automated SEO report?
A report whose numbers refresh themselves and whose layout is already decided, so that producing it each month costs nobody any time. The data comes live from Google Search Console and Google Analytics, the sections are built into the template, and the file is emailed on a schedule. The only manual part left is reading it.
How do I create automated SEO reports for clients?
Connect a report template to the client's Search Console and Analytics properties, set your brand terms once, and put it on an email schedule. What makes it repeatable is that the layout and the classification are decided once, in the template, rather than rebuilt for each client every month.
What is automated SEO reporting?
The practice of letting the report build and deliver itself. Three jobs hide inside the phrase: collecting the data, which Google already does for free; arranging it, which is the part that eats the time and is what a template decides once; and sending it, which is a schedule. Automated SEO reporting means the second and the third stop being work, and the only part left for a person is reading the result and deciding what to do about it.
What should an automated SEO report include?
Two halves. From Search Console: impressions, clicks, click-through rate and average position with their change against the previous period, branded queries kept apart from generic ones, the count of queries in each position band, and the queries that moved most. From Analytics: landing pages, engagement, goals completed and the channel split, so the report says what happened after the click and not only where the site ranked.
Can Data Studio send SEO reports automatically?
Yes. Data Studio emails a report to a list of recipients on a schedule you set, with the pages rendered as they stand at that moment. Scheduling is what turns a live dashboard, which waits to be opened, into a report, which arrives.
What is an automated SEO dashboard?
The same thing seen from the other side. A dashboard waits to be opened; a report arrives. One file does both jobs here, so the client who likes to look whenever they want gets a link and the client who would rather receive it gets it in the inbox, from the same copy and without maintaining two things.
Do I need GA4 and Search Console, or is one enough?
One is enough for half the questions. Search Console alone tells you what the site ranks for and nothing about what visitors did; Analytics alone tells you what visitors did and nothing about what they searched. This template covers both because the useful question, whether the traffic is worth having, needs both.
What access do I need to a client's data?
View permission on each property is enough. Google's documentation for the Search Console connector asks only that you have at least view permission, which a client grants from their own account without giving up ownership and can withdraw at any time. The row limit that governs how much the report reads is counted per site, not per account, so running one copy per client does not make them compete for the same allowance.
Is the report white label?
Your logo, your colours and your fonts, and the link you share is yours. Once copied, the file is yours, and nothing in it has to say where the layout came from.
Can I use the template for several clients?
Yes. One copy per client, each pointed at that client's own two properties, each with its own brand list and its own schedule. The price is one payment, not one per client.
Sources
- [1]Swydo, Best SEO reporting software. Source for the five hours per client per month spent on manual reports, and for the fifty hours a month that becomes on a ten-client roster.
- [2]Google Search Console Help, Performance report: the newest data can be preliminary and may change in the following hours.
- [3]Google Search Console Help, What are impressions, position, and clicks? Source for the definition of position and of average position across all impressions.
- [4]Google Search Central blog, A deep dive into Search Console performance data filtering and limits. Source for the row limits and for the definition of anonymized queries, which is why per-query clicks do not add up to total clicks.
- [5]Google Cloud documentation, Connect to Search Console (Data Studio). Source for the access a Google account needs to use a property as a data source: at least view permission on that property.