A white label report is a report that carries your agency's name instead of the name of whoever built the layout. Your logo, your colours, your link. The client reads it and sees your work, because it is your work: the tool that arranged it is not part of the conversation.
Applied to search, that is what an agency wants in front of a client every month: a branded screen of rankings and results, with the agency's name on it. Underneath sits the question that decides what the report costs, which is where those numbers should come from.
For the sites you manage, the answer is an account you already have. Google Search Console holds every query each of those sites appeared for, with the position Google itself recorded at the moment of each impression. That is the strongest ranking data any agency can put in front of a client, it belongs to the client already. It carries no monthly fee per client.
Our templates turn it into a branded report. This page is about what that report contains, what you change to make it yours. What it costs when you run eleven of them.
What white label means on a report, and what it does not
White labelling is presentation. The report shows your brand, and nothing in it advertises the tool underneath. That is the whole of it. The reason it matters is not vanity: a report that arrives with a stranger's logo on it invites the client to wonder what else is outsourced.
The name moves around more than the thing does. An SEO white label report, an SEO white label dashboard, white label reports in general, white label reporting as a practice: they all describe the same arrangement, which is your brand on somebody else's layout. Nothing below depends on which of those you typed.
What white labelling is not is a claim about the data. Nobody rebrands Google. The numbers in a white label SEO report still come from Search Console and Analytics. The client is entitled to know that, because it is the reason to trust them. What you are presenting as yours is the analysis and the arrangement, which genuinely are.
Two things that often get sold as white labelling and are not. A custom domain for the report is hosting, not branding, and Data Studio does not do it. And removing every trace of Google from a report built on Google data is neither possible nor desirable.
Where the positions in a branded report come from
This is the part that decides whether a client believes the report, so it is worth being precise about it.
Search Console reports every query for which the site was actually shown, with the position Google recorded at the moment of each impression. Google's documentation defines that position as the ranking of your link, averaged across all the impressions it received, because the position differs each time it is seen. Nobody supplied Google with a keyword list to watch: it is reporting what happened, on the whole of the site, including the searches nobody thought to track.
That last part is what makes it the better foundation for a client report. We take the whole of that table apart, page by page, in the keyword ranking report walkthrough. A tracked list shows you the keywords somebody already decided were important. The report shows you the ones the site is actually winning, which is where the pleasant surprises live. It costs nothing to read because the client's own property already holds it.
The four things you change to make the report yours
This is the part the other articles about white labelling never show, so here it is concretely. In a Data Studio report there are four things to change, and none of them is technical.
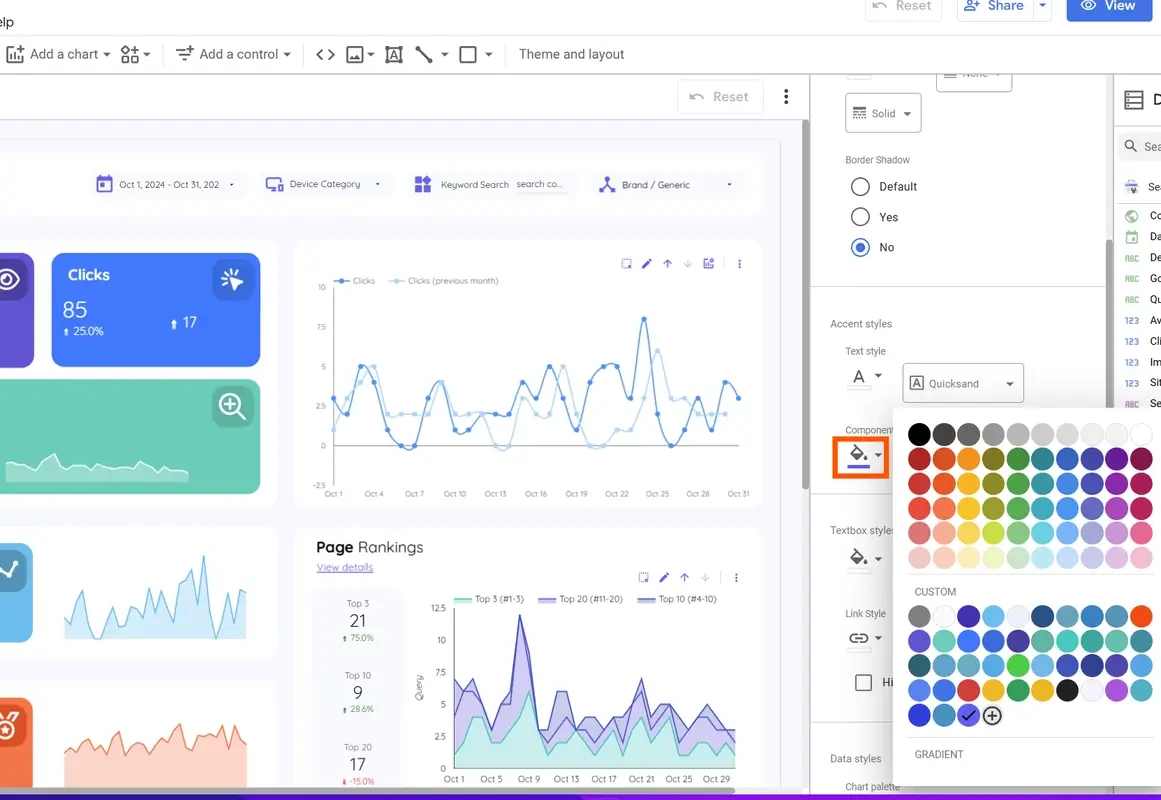
The colours come first, because they do most of the work. A report set to your palette reads as yours before anybody looks at the logo. Then the logo itself, dropped onto the page and positioned once.
The four changes, in the order that saves time
The palette
Set the report theme to your own colours. It applies to every chart on every page at once, which is why it goes first: do it after the logo and you will be checking pages twice.The logo
Drop it on the header of the first page, size it once, then replicate it across the rest of the pages rather than placing it again on each one.The fonts
Match the report to whatever your proposals and decks already use. This is the change nobody notices consciously and everybody notices anyway.The link
What the client actually receives. Share it as a link, schedule it to arrive by email, or embed it in your own client area.
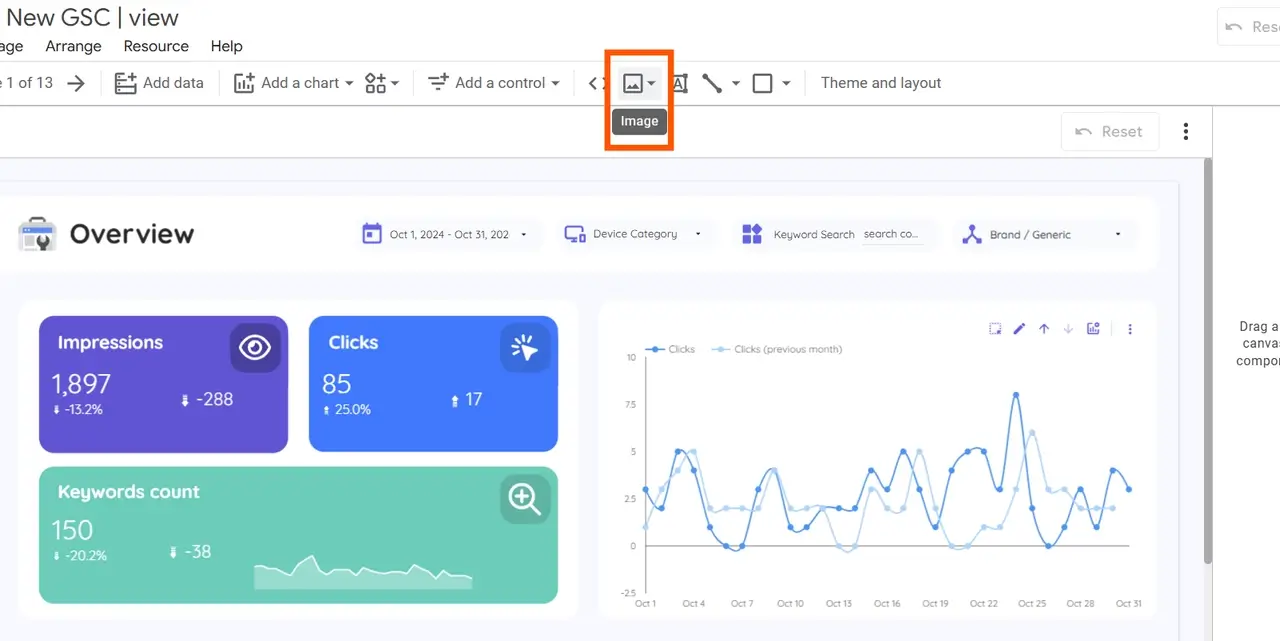
Then the fonts, and then the link you share, which is the part clients actually receive. Our step by step guide covers all four with the screens: how to put your logo and colours on a Data Studio report. If the client prefers a link to an inbox, sharing a report properly is a short read. connecting the property is the step before all of this. It takes a few minutes the first time and less after that, because the second client is a copy of the first with a different palette.
What a white label SEO report has to contain
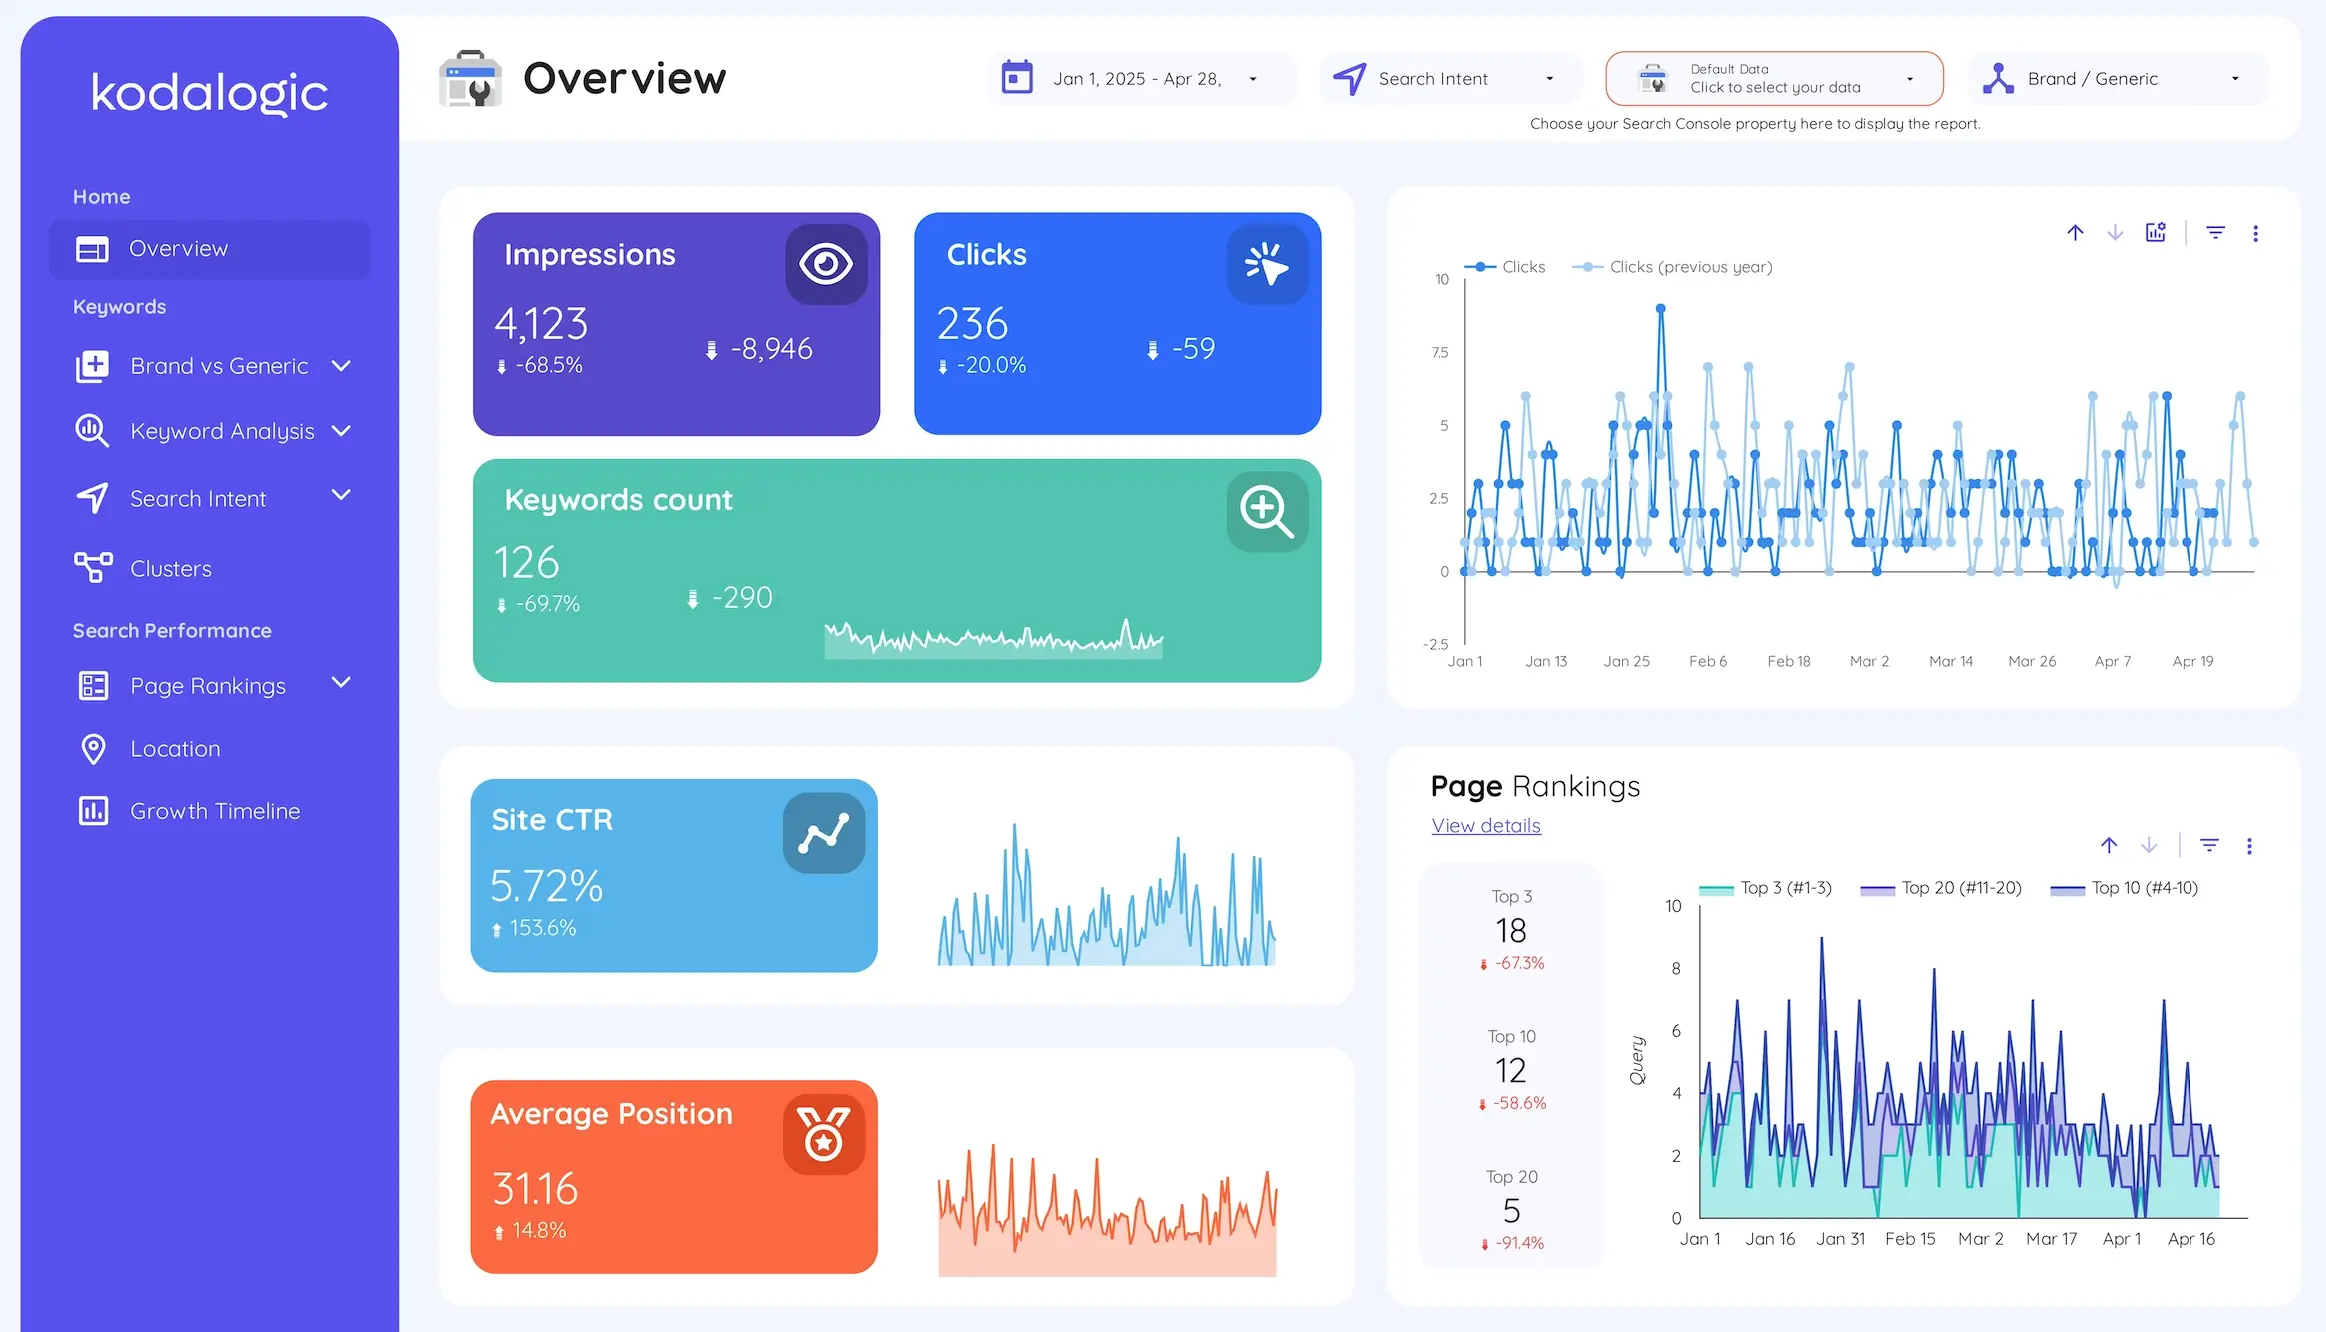
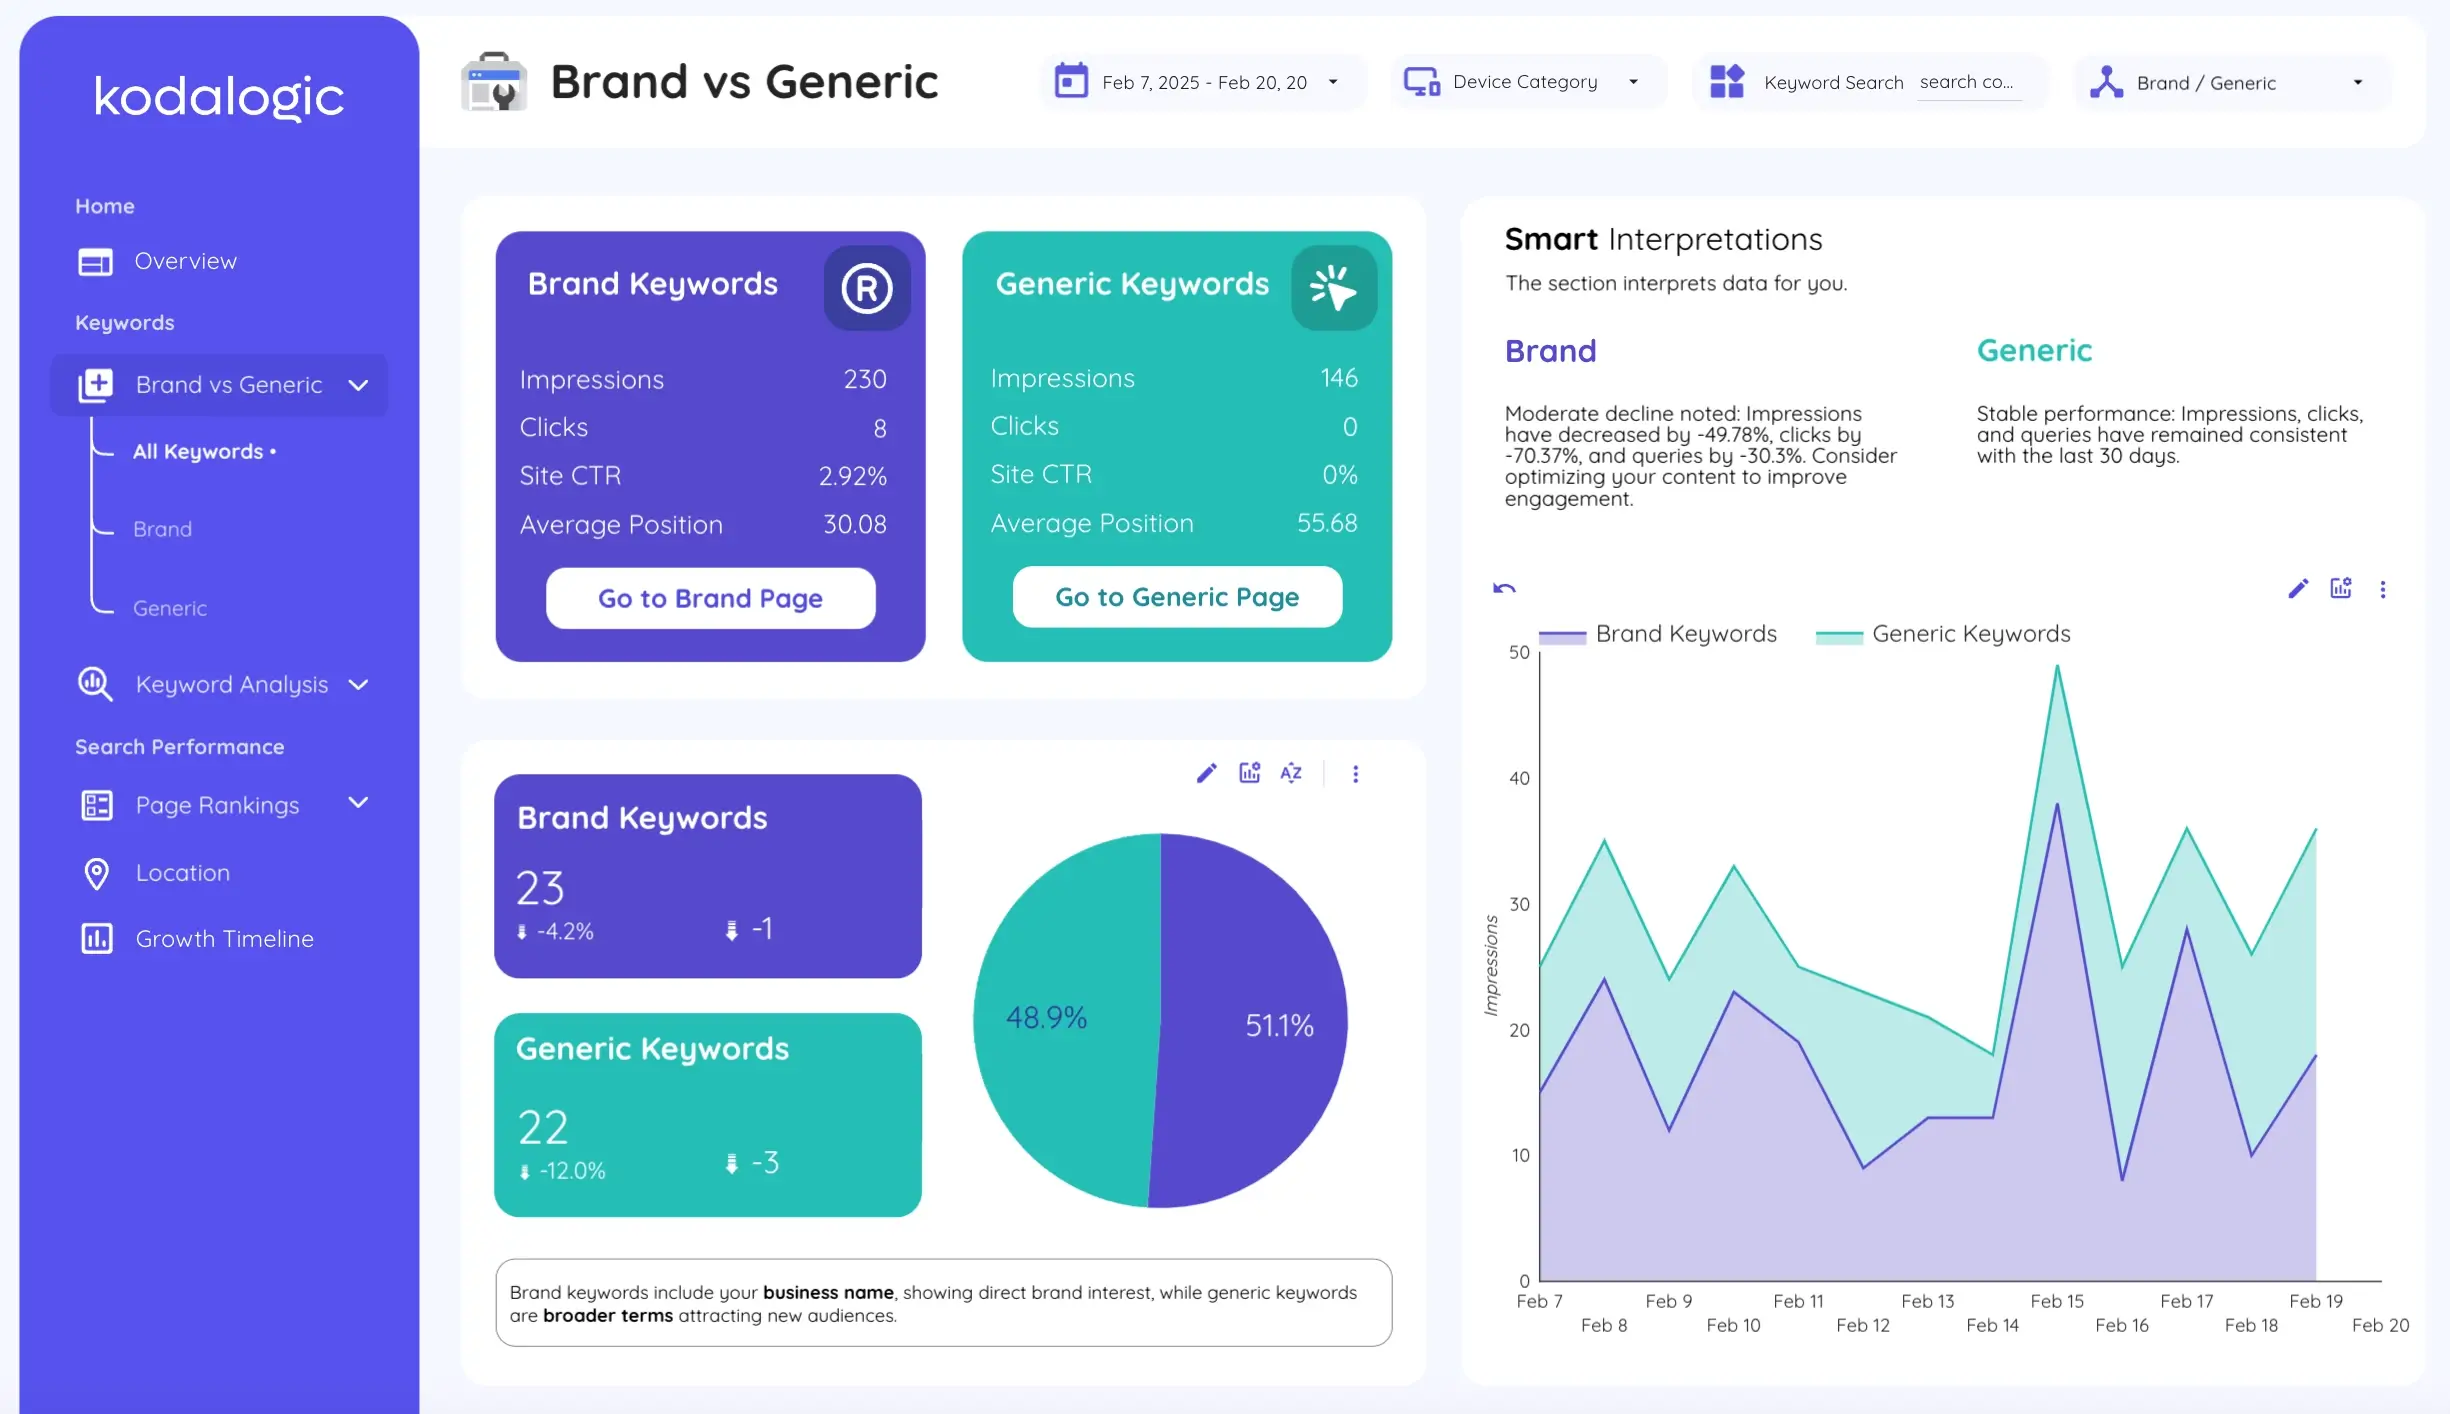
Branding decides whether the report gets taken seriously. Contents decide whether it gets renewed. SEO white label reports live or die on this page of the list. A ranking report that a client can act on holds these, and our templates arrive with all of them already laid out.
What a client asks, and what answers it
What the client actually asks
- Are we ranking better than last month?
- Are people searching for us by name, or finding us cold?
- Which of these searches are worth anything?
- What changed, and was it us?
- Is any of this turning into business?
The section that answers it
- Position bands: how many keywords on page one, two and beyond, and the movement since last quarter
- Brand against generic, split automatically from your own brand list
- Query length and intent, so a position means something
- Improved and declined keywords against the comparison period
- The Analytics side: landing pages, engagement and goals completed
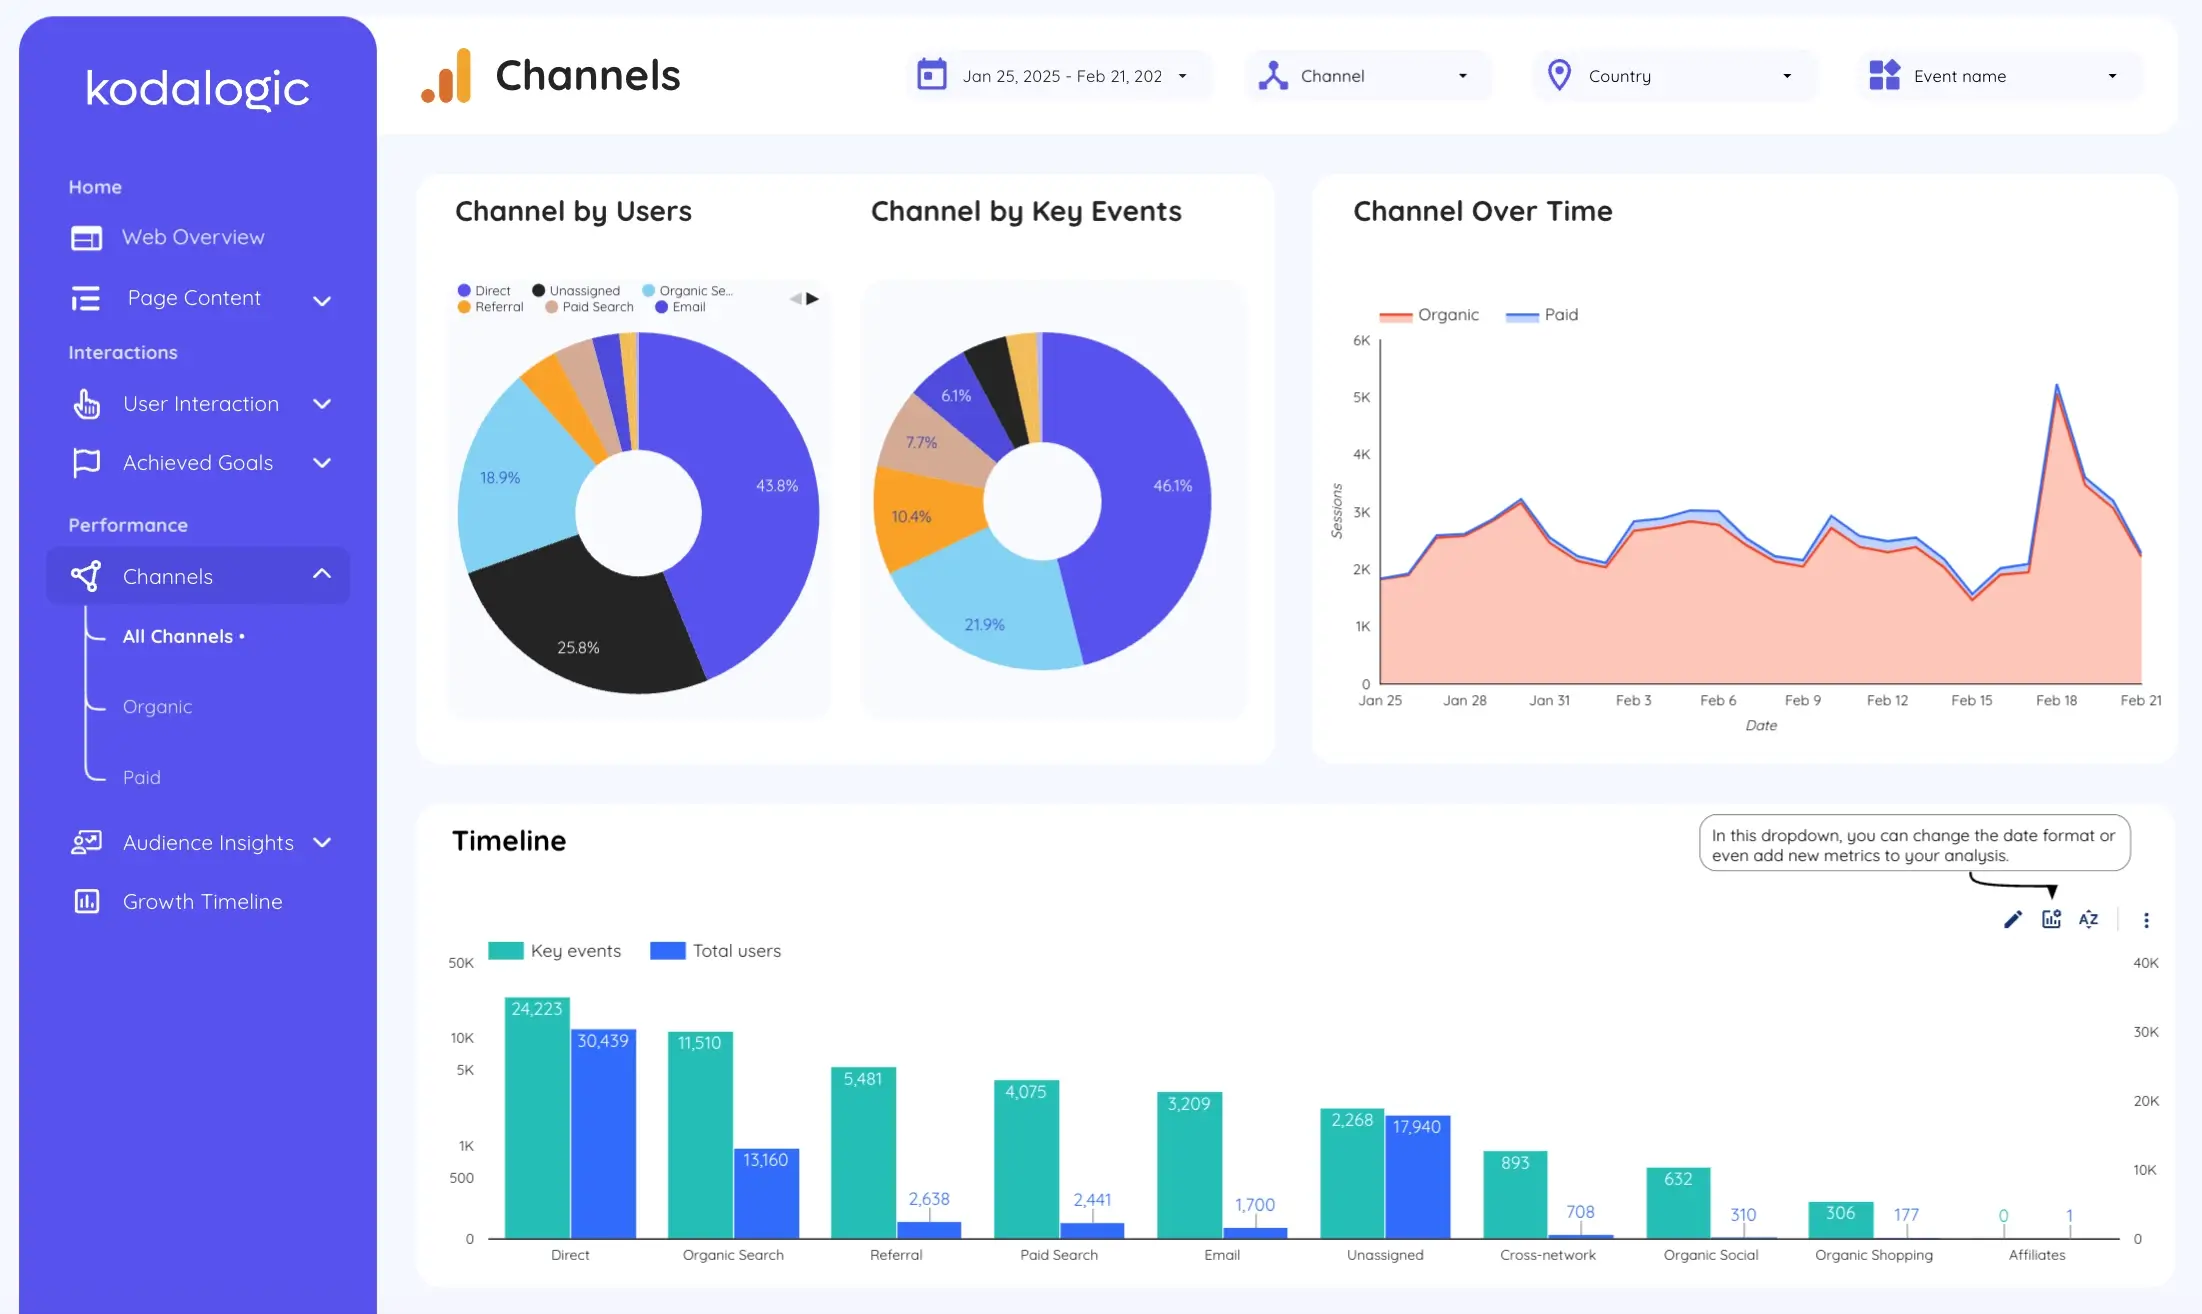
There is one more thing that matters more in a white label report than anywhere else. When a report leaves your office with your logo on it, you are not standing next to it to explain the charts. Our reports write the reading themselves on every refresh, in plain language. That the page says whether the period was stable, improving or declining before the client interprets a single axis. How that works has its own page.
One report, many clients, and what that costs
This is where white labelling either scales or quietly eats the margin it was supposed to protect.
A vendor of subscription reporting software, on its own blog and with no reason to make the number look large, puts manual client reporting at five hours per client per month. On a roster of ten clients that is fifty hours a month spent rebuilding the same report on new numbers. This is the cost white labelling is supposed to remove and often does not, because a branded report built by hand is still built by hand.
A template changes the arithmetic because it is copied rather than rebuilt. Once a copy exists in your Google account it is an ordinary Data Studio file: one per client, each pointed at that client's properties, each with that client's palette. And the access needed is modest. Google's documentation for the Search Console connector asks only that the account have at least view permission on the property. This a client grants from their own account without handing over ownership and can withdraw whenever they like.
An agency running several clients from one screen is a problem of its own, and we wrote how we handle it separately. The keyword ranking report is $129 and covers the search side on its own. The Web and SEO report is $214 and adds what visitors did after the click. Both are paid once, for every client you report on, not once per client.
What to charge for it
Reporting rarely appears as a line on an invoice, and it should not start now. It sits inside the retainer, which is exactly why its cost is invisible until somebody measures it: the hours are already paid for, so nobody counts them.
That is the argument for making the report cost a fixed amount once instead of hours every month. The retainer does not change, the client gets a better report. The hours that were going into rebuilding it go into the work the client is actually paying for. If you present reporting as a deliverable at all, present it as what it is now: a branded dashboard the client can open whenever they like, not a PDF that arrives when someone gets round to it.
One practical note for agencies that itemise. A dashboard a client can open at any hour reads as a higher tier of service than a monthly attachment, and it costs less to produce. That is an unusually easy conversation to have at renewal.
4.97
Average rating
out of 5, on Fiverr
16
Reviewed more than once
the same buyer, coming back
27
Countries
where the reviewers wrote from
Kodalogic builds dashboards to order as well as selling them ready-made. The three numbers above come from the reviews page, which lists every one of them. One of the repeat buyers puts it in a line: "Excellent Data Studio design and customization service. Used multiple times now and always an awesome experience."
Three things to say out loud in the meeting
Your logo on the report puts your name behind the numbers, so it is worth knowing how the numbers behave. These three come up in client meetings. An agency that explains them before being asked looks like the expert in the room.
The first is that a position is an average. Google records the ranking of the link at each impression and reports the mean. A keyword that spent half the month at the top of page one and half further back arrives as one number in between. When a client says a keyword "was higher last week", this is usually why. It is Google's definition rather than anybody's reporting choice.
The second is that the per-query numbers describe the queries Google lists. Google withholds a query from the table when too few people searched it, while still counting its clicks in the total. The itemised table is always a little smaller than the whole. Saying so before a client spots it turns an awkward question into a demonstration that you read your own reports.
The third is the useful one. Because Search Console covers every query the site appeared for rather than a chosen list, the report keeps finding searches nobody was tracking. That is the section clients remember, and it is the argument for reviewing the report together rather than emailing it and hoping.
Frequently asked questions
- What is a white label SEO report?
- A report on a client's search performance that carries your agency's branding rather than the branding of the tool that produced it: your logo, your colours, your fonts and a link you share. The data still comes from Google Search Console and Google Analytics, and saying so is what makes the report credible.
- What do I need to build a white label ranking dashboard?
- A Google account, view permission on the client's Search Console property, and a report to put your brand on. Our keyword ranking report arrives with the pages already built and the classification already done, so the work is branding it and pointing it at the property. There is nothing to install and nothing to subscribe to.
- Where do the positions in the report come from?
- From Google Search Console, which records the position of your link at the moment of each impression and reports it averaged across those impressions. It covers every query the site was shown for, not a list somebody chose in advance, which is why a client report built on it regularly surfaces searches nobody was tracking.
- How do I white label a Data Studio report?
- Four changes and none of them technical: the colour palette, the logo, the fonts, and the link you share. Brand one master copy first and then duplicate it per client, so the branding travels with every copy instead of being redone each time. Our step by step guide shows each screen.
- Can I use one template for several clients?
- Yes. Once copied, the report is an ordinary Data Studio file in your own Google account. One copy per client, each pointed at that client's property, each with its own palette and its own brand keyword list. One payment covers every client you report on.
- What access do I need to a client's Search Console?
- At least view permission on the property, which is what Google's documentation for the connector asks for. The client grants it from their own Search Console without giving up ownership and can withdraw it at any time.
- Can the report live on my own site?
- Yes, embedded. A Data Studio report is shared as a link or embedded in a page you control, so it can sit inside your own client area with your navigation around it. In practice what the client remembers is the branding on the report itself, which is why the palette and the logo matter more than the address.
Sources
- 1.Swydo, Best SEO reporting software. Source for the five hours per client per month spent on manual reports, and for the fifty hours a month that becomes on a ten-client roster. ↩
- 2.Google Search Console Help, What are impressions, position, and clicks? Source for position being the ranking of the link, averaged across all impressions because it differs each time it is seen. ↩
- 3.Google Search Central blog, A deep dive into Search Console performance data filtering and limits. Source for anonymized queries, which is why per-query clicks do not add up to total clicks. ↩
- 4.Google Cloud documentation, Connect to Search Console (Data Studio). Source for the access a Google account needs to use a property as a data source: at least view permission on that property. ↩

Written by
Daniel CorreaHe builds the platform the templates are sold, delivered and updated on.