06 of April of 2026
PPC Dashboard in Data Studio: Track ROAS Without the Spreadsheet

Isaac Correa
Looker Studio Templates
Data Integration & Sources
SEO & Marketing Dashboards
Most PPC managers spend more time building reports than optimizing campaigns. A Looker Studio dashboard connected to Google Ads changes that.
Managing PPC campaigns requires constant monitoring and optimization. But Google Ads, with its complex interface, often makes it difficult to extract meaningful insights—especially for those who aren’t experts.
Sending reports to clients adds another layer of complexity. Screenshots and manual reporting take time, and interpreting raw data from Google Ads can be overwhelming.
This is where a Google Ads dashboard in Data Studio (formerly Looker Studio) makes all the difference. It simplifies data analysis, automates reporting, and presents clear, visually appealing insights that are easy to understand and share.
Let’s explore how our Google Ads Dashboard can transform the way you manage PPC campaigns.
The Challenge: Google Ads Data is Hard to Read
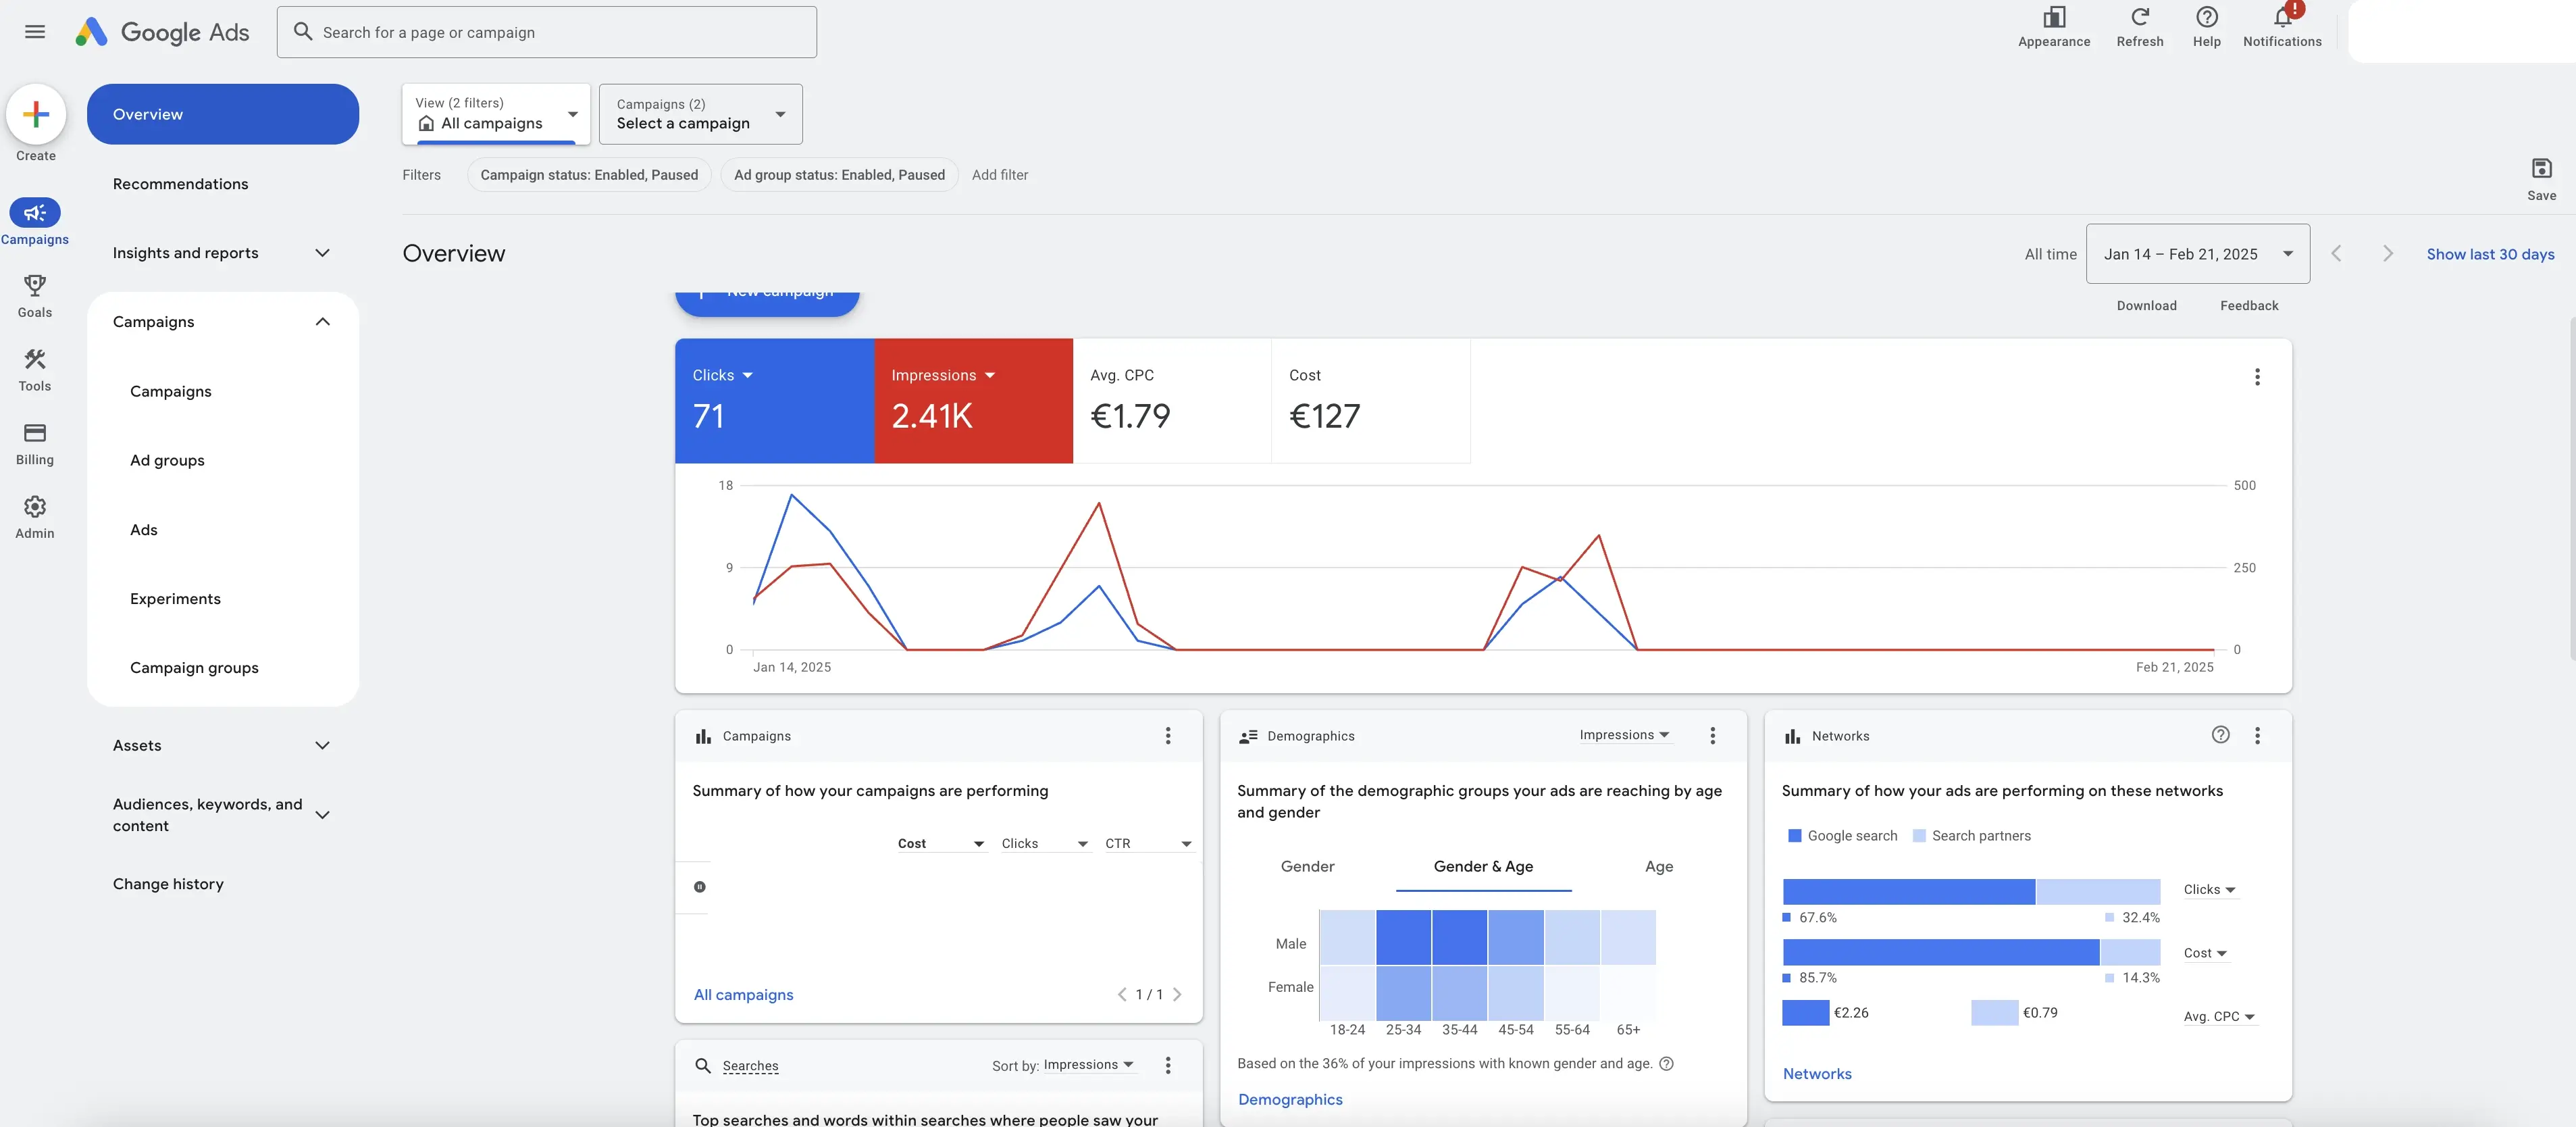
Google Ads provides powerful tools, but its interface isn’t designed for quick insights. The challenges include:
- Navigating between multiple sections just to find key data.
- Manually generating reports for clients every month.
- Understanding keyword performance, which is buried under complex filters.
- Comparing campaign types, such as search and display, without a clear breakdown.
Without a proper reporting tool, you spend more time extracting data than optimizing campaigns.
A Better Solution: Google Ads Dashboard in Looker Studio
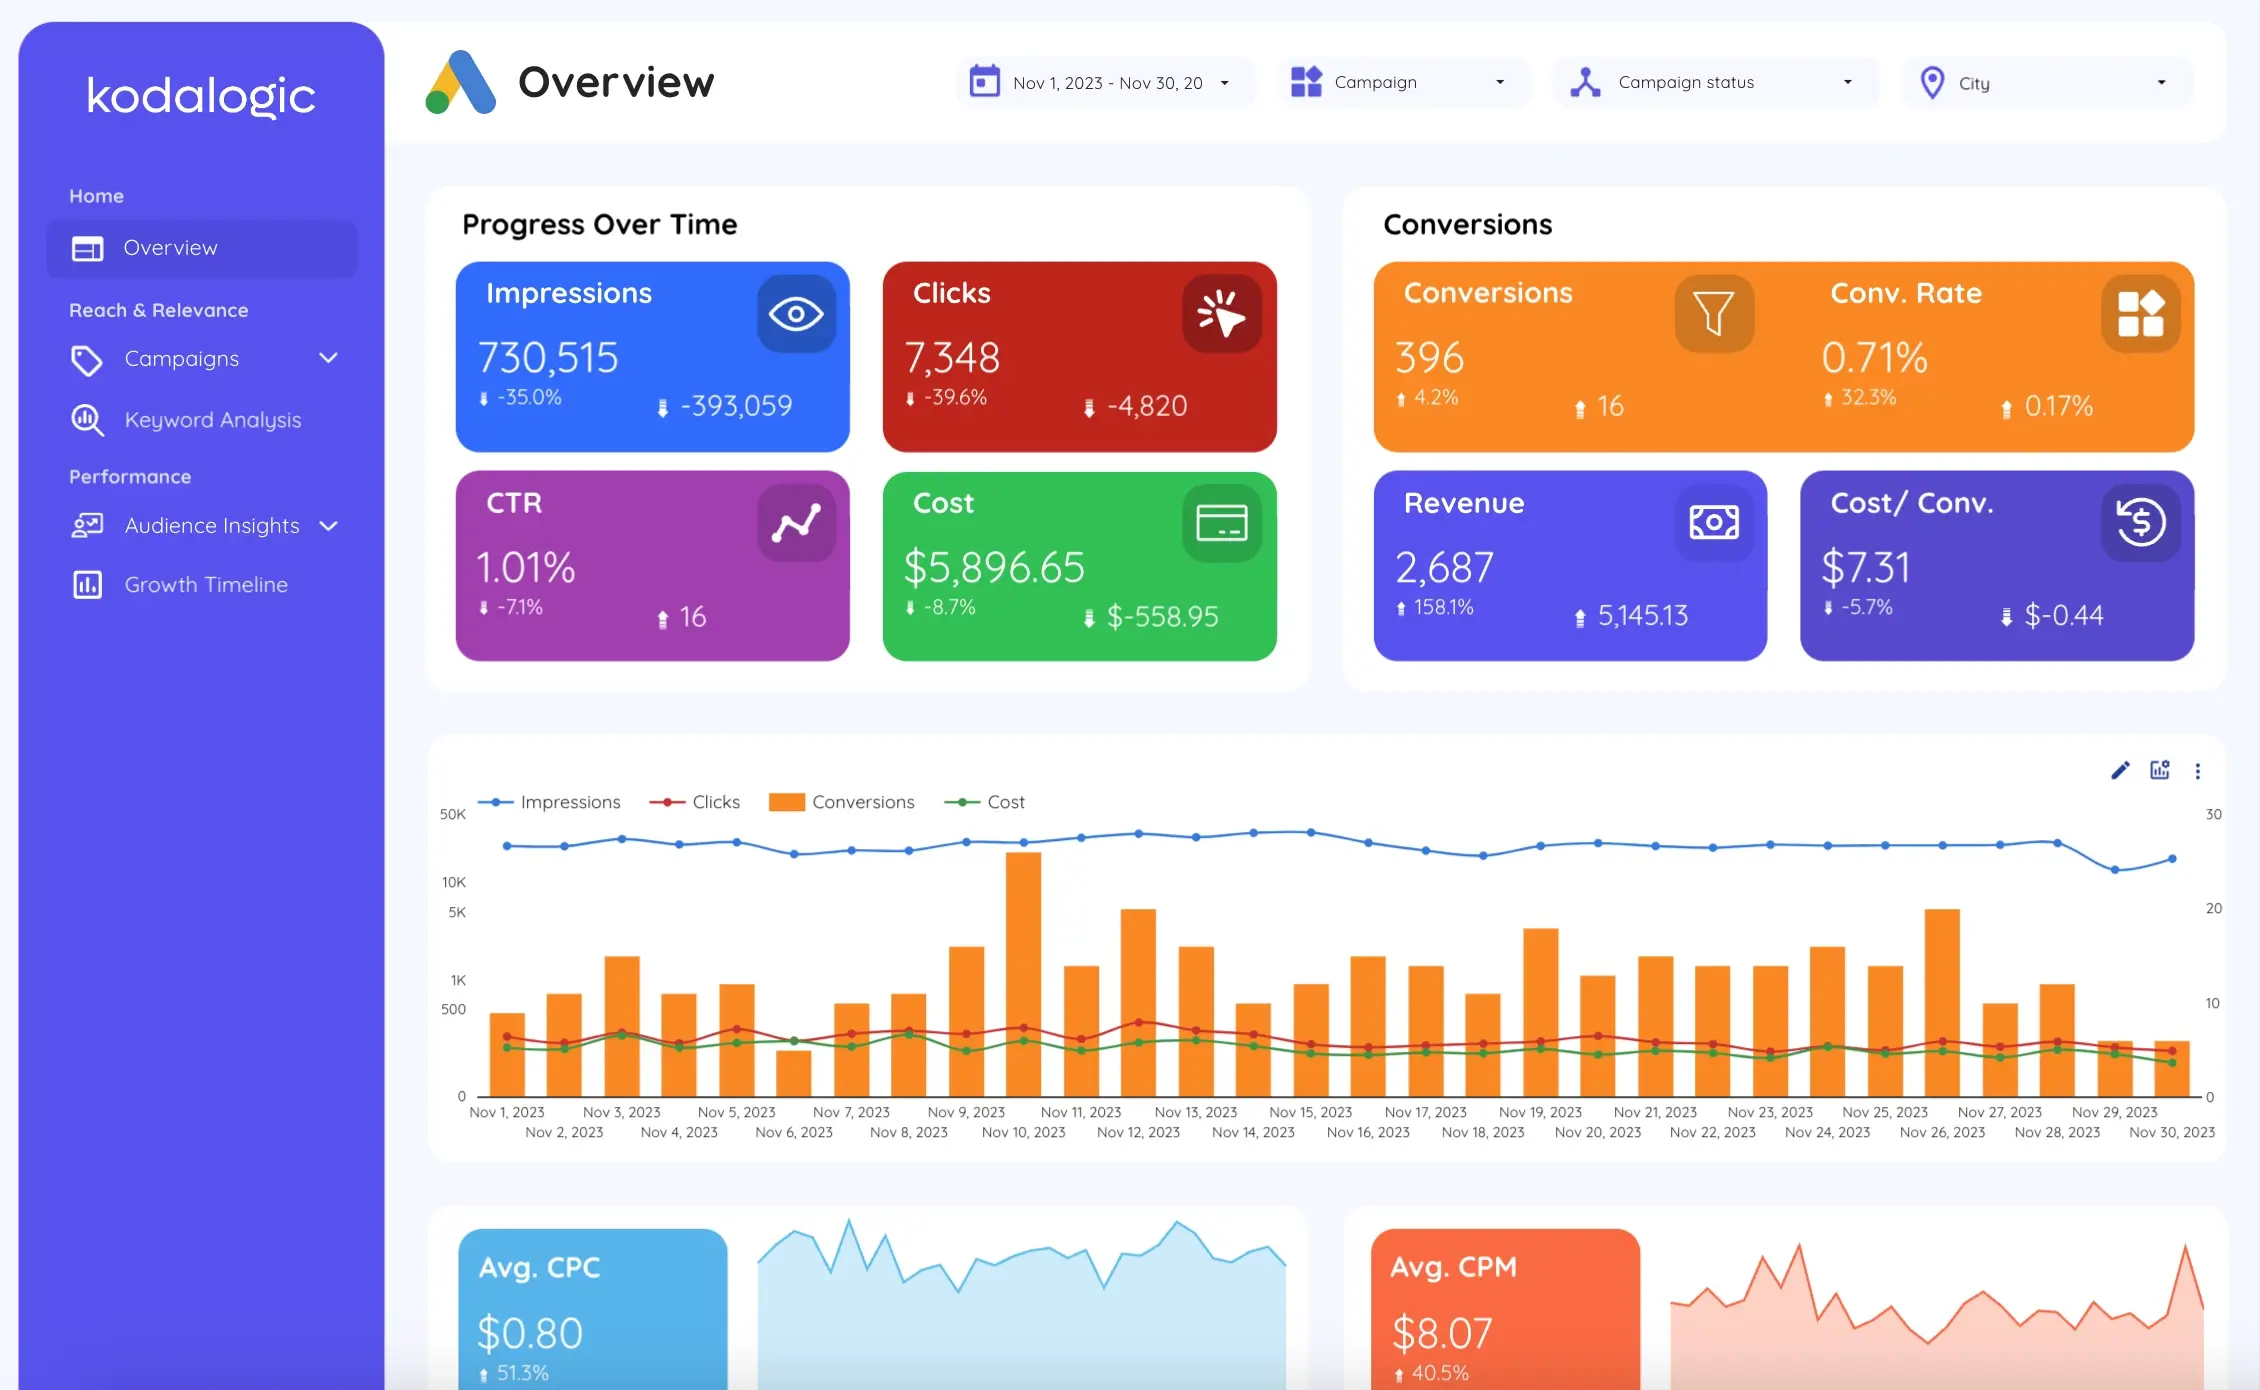
Our Google Ads Dashboard in Looker Studio is built to simplify data analysis and reporting.
- Clear, structured pages—organized by campaigns, keywords, audiences, and conversions.
- Easy-to-read insights—instantly see what’s working and what’s not.
- Automated reporting—no more manual screenshots or exporting data every month.
- Custom branding options—adapt reports to match your agency’s or client’s identity.
With this dashboard, data becomes actionable.
Campaign Analysis: Which Campaigns Perform Best?
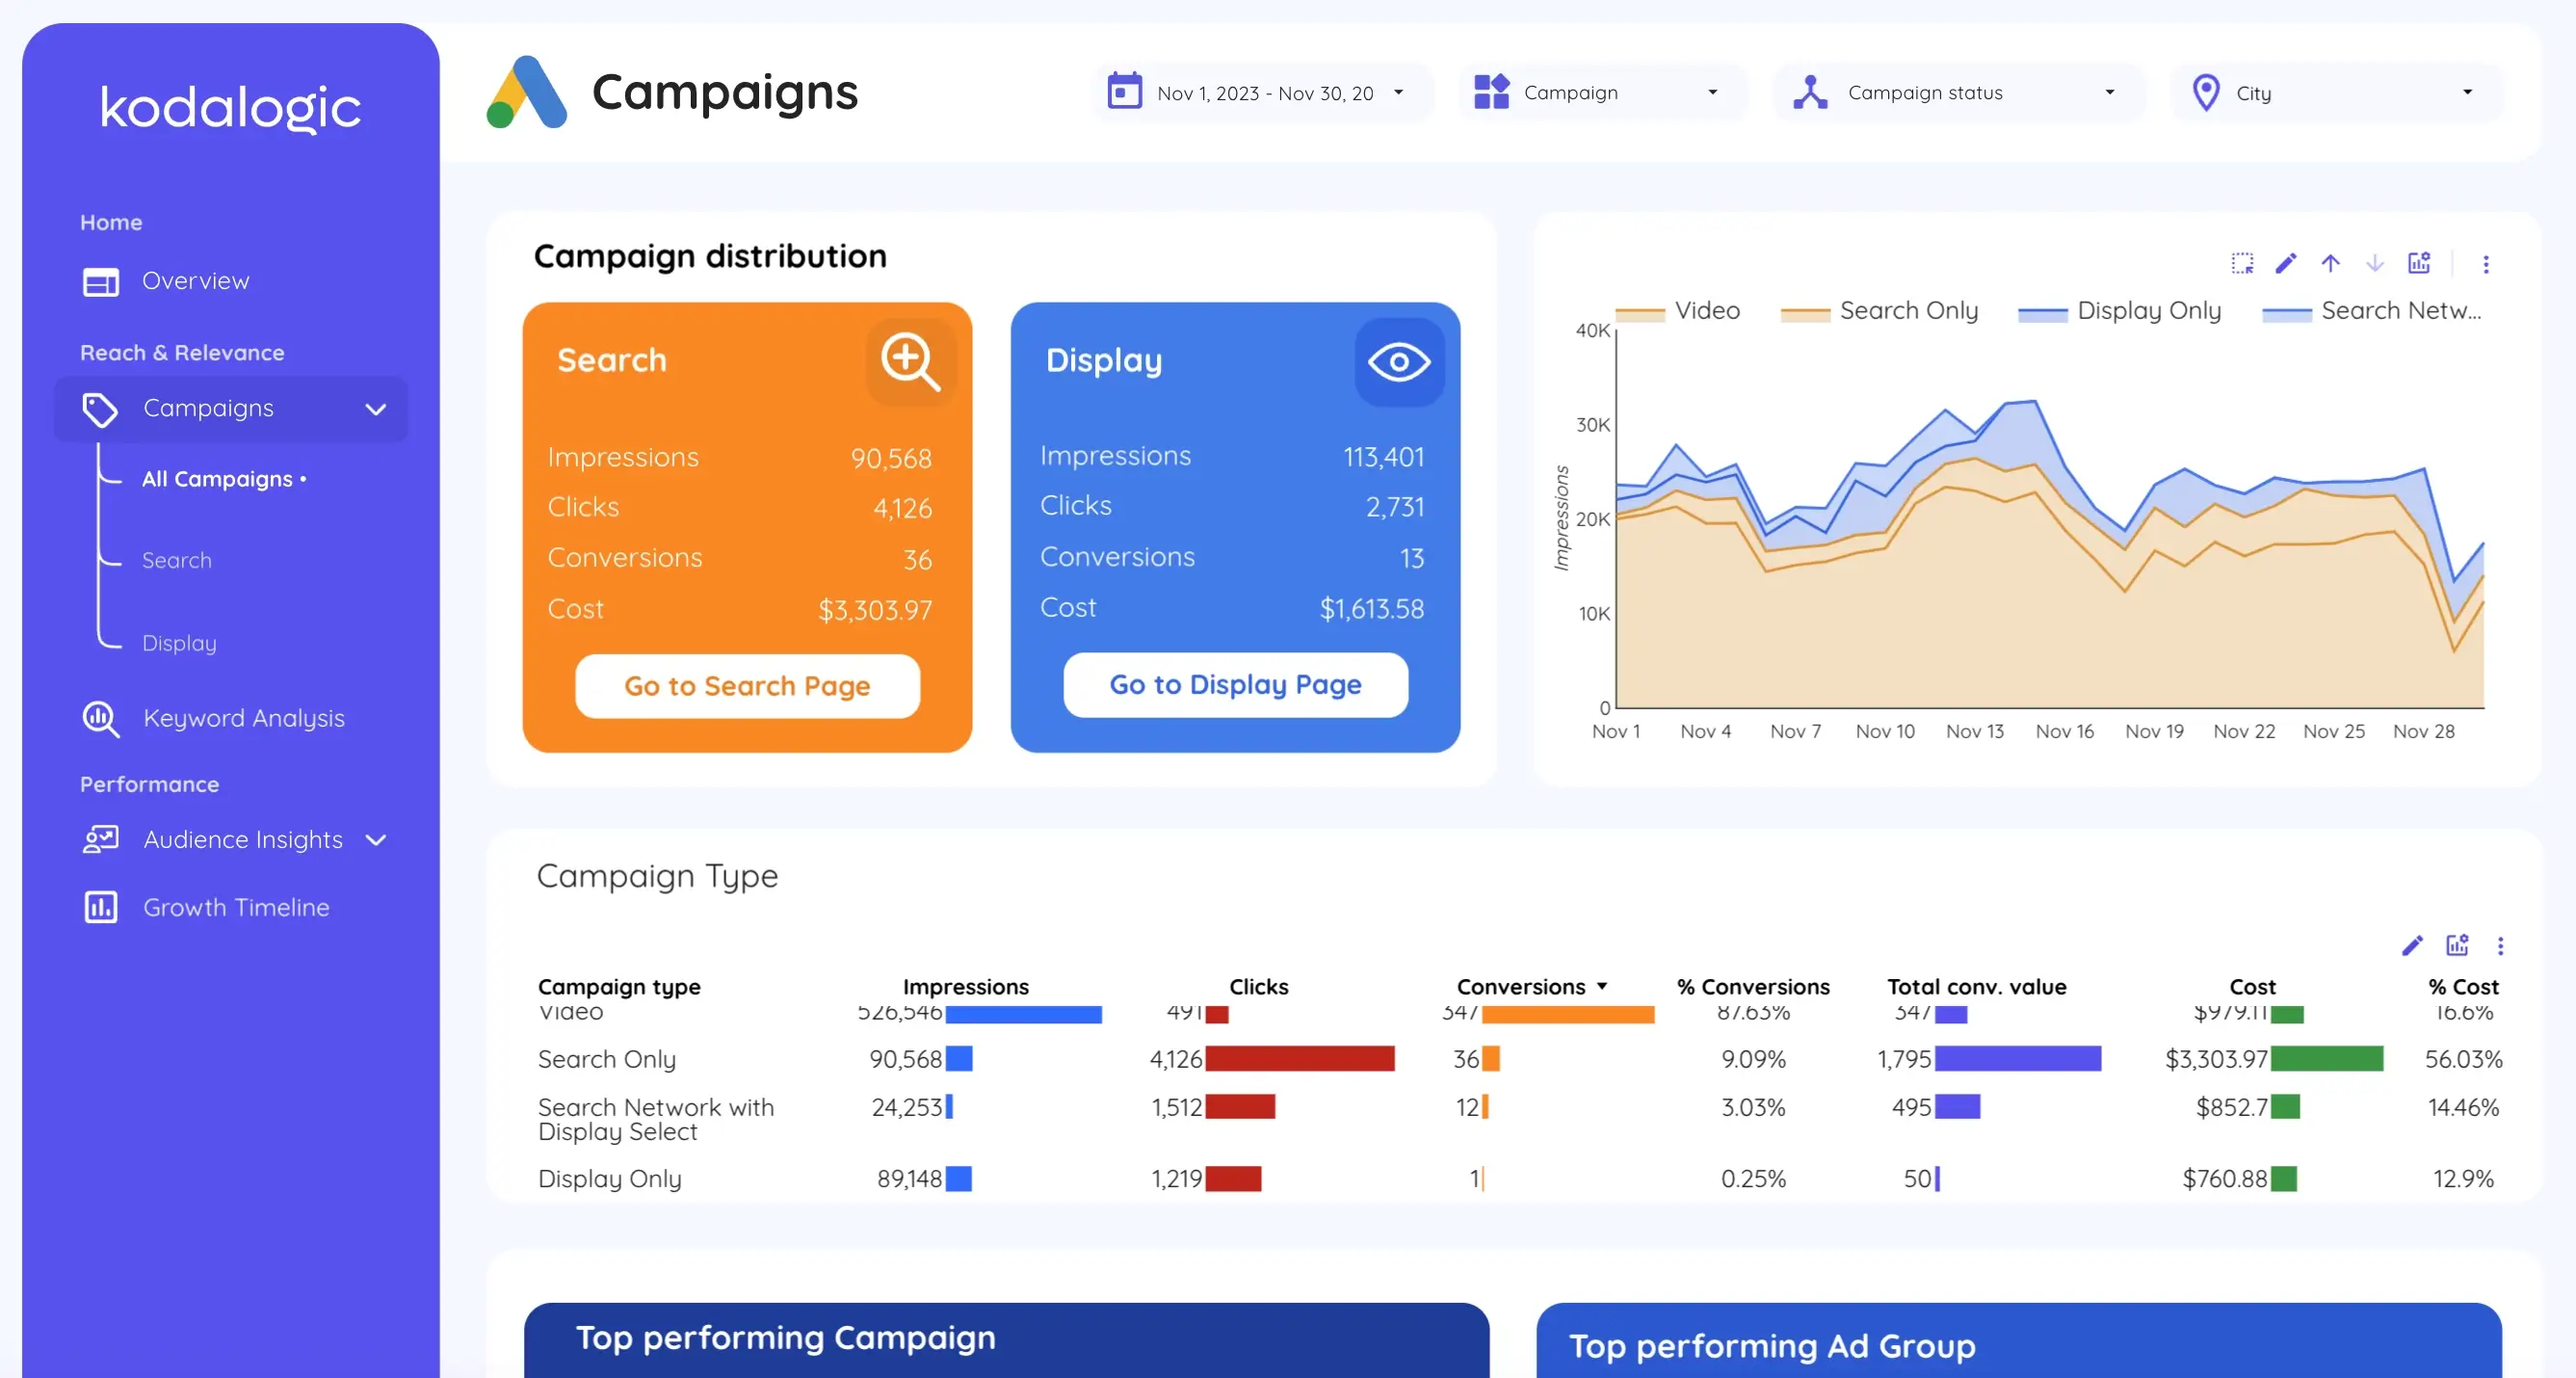
Understanding campaign performance is key to optimizing budget allocation. Our dashboard categorizes campaigns by type, making it easy to see:
- Which campaigns drive the best results—search, display, video, or shopping.
- Cost vs. conversions—how much you’re spending relative to actual conversions.
- CTR and CPC comparisons—which campaign type delivers the best efficiency.
With side-by-side comparisons, you can adjust strategies in real time instead of waiting for end-of-month reports.
Keyword Performance: Find the Most Valuable Keywords
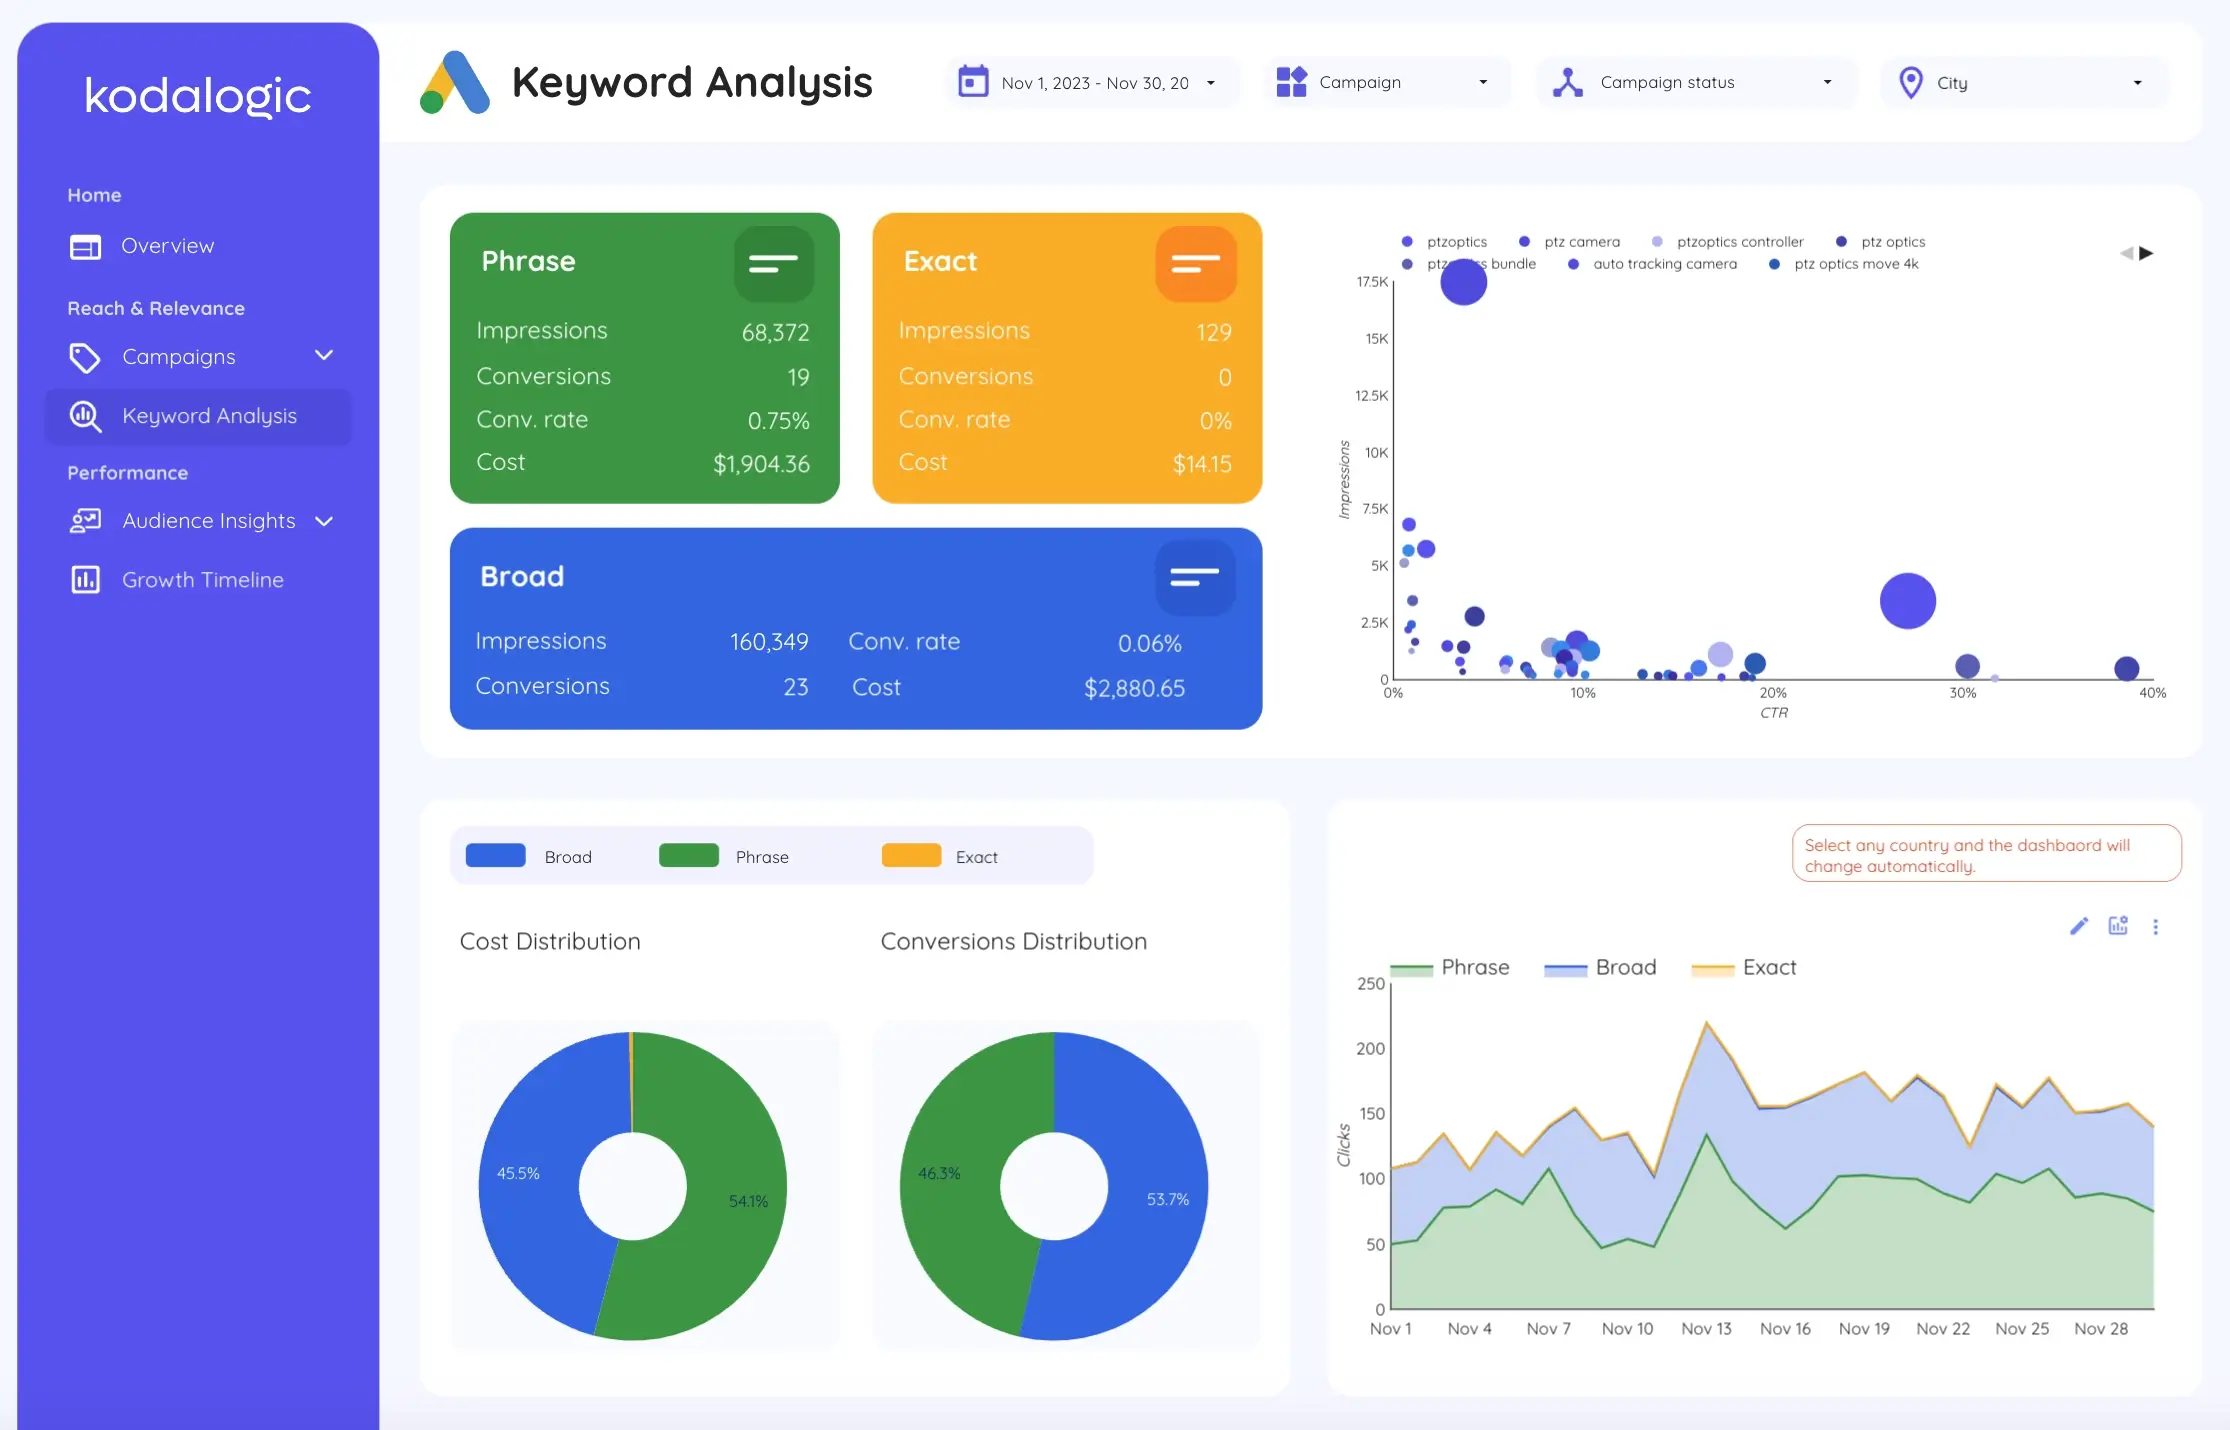
Keyword performance is often difficult to analyze in Google Ads, especially when dealing with different match types.
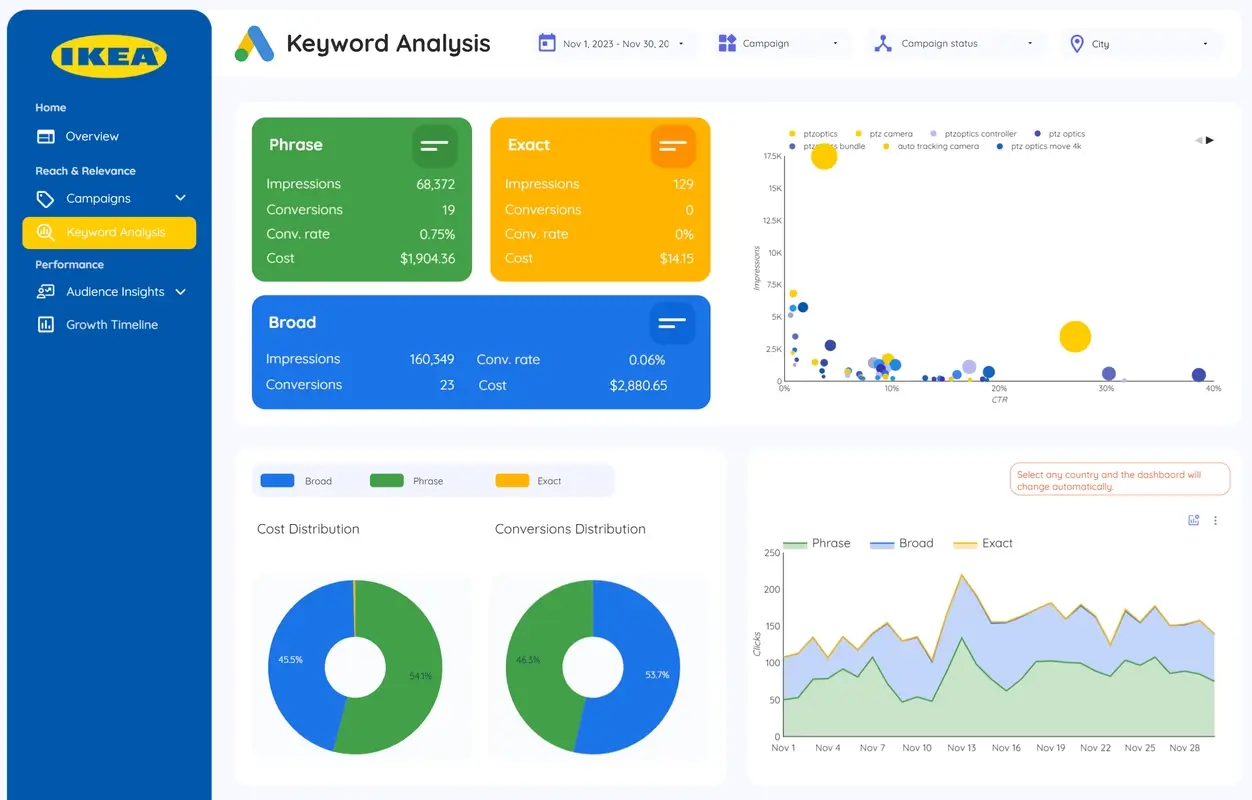
Our Keyword Analysis Page provides:
- A clear breakdown of phrase, exact, and broad match keywords.
- A bubble chart visualization to quickly identify high-performing keywords.
- Cost-per-click (CPC) and conversion tracking for every keyword.
- User search terms—see what real users are searching for, beyond your targeted keywords.
This eliminates guesswork and helps refine bidding strategies for better ROI.
Audience Insights: Who is Engaging With Your Ads?
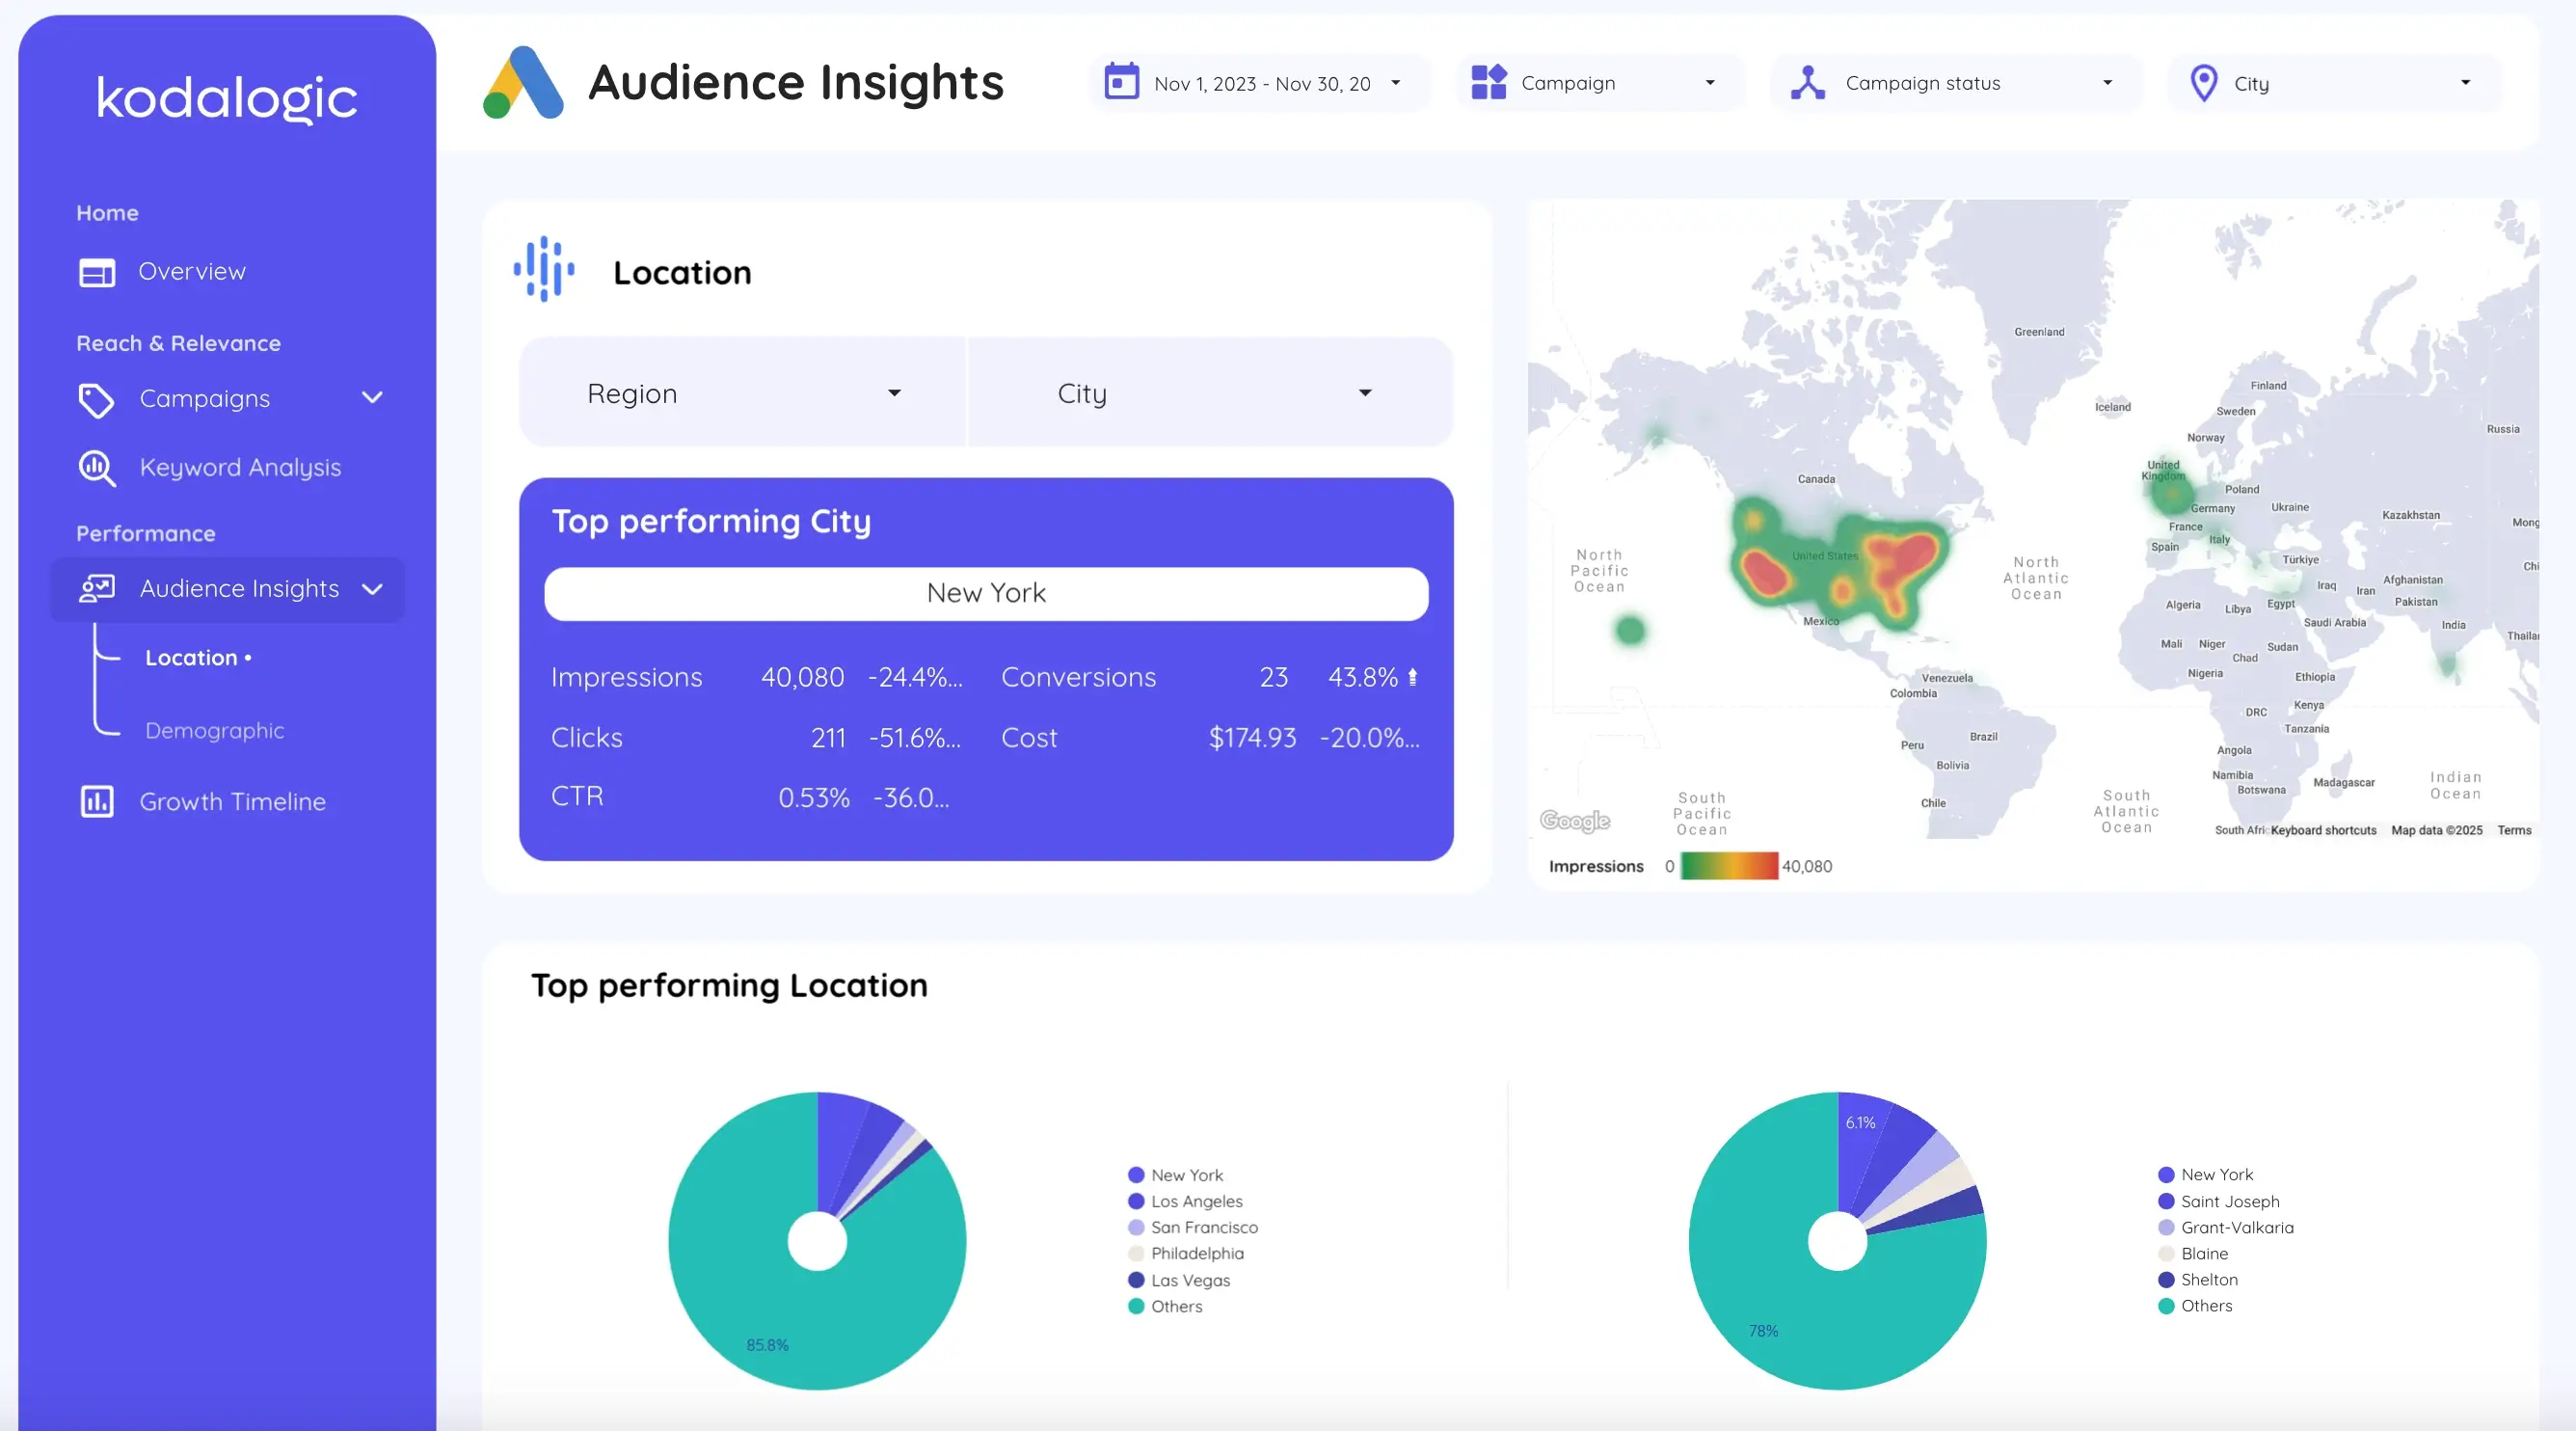
Knowing who engages with your ads is crucial for optimizing targeting and ad spend. Our dashboard separates audience insights into:
- Demographics (age and gender)—which segments have the highest conversion rates.
- Location-based performance—which countries or regions drive the best ROI.
For example, your ads may receive the most impressions from users aged 18-24, but if the highest conversions come from users aged 35-44, you can adjust bidding strategies accordingly.
Campaign Timeline: Track Performance Over Time
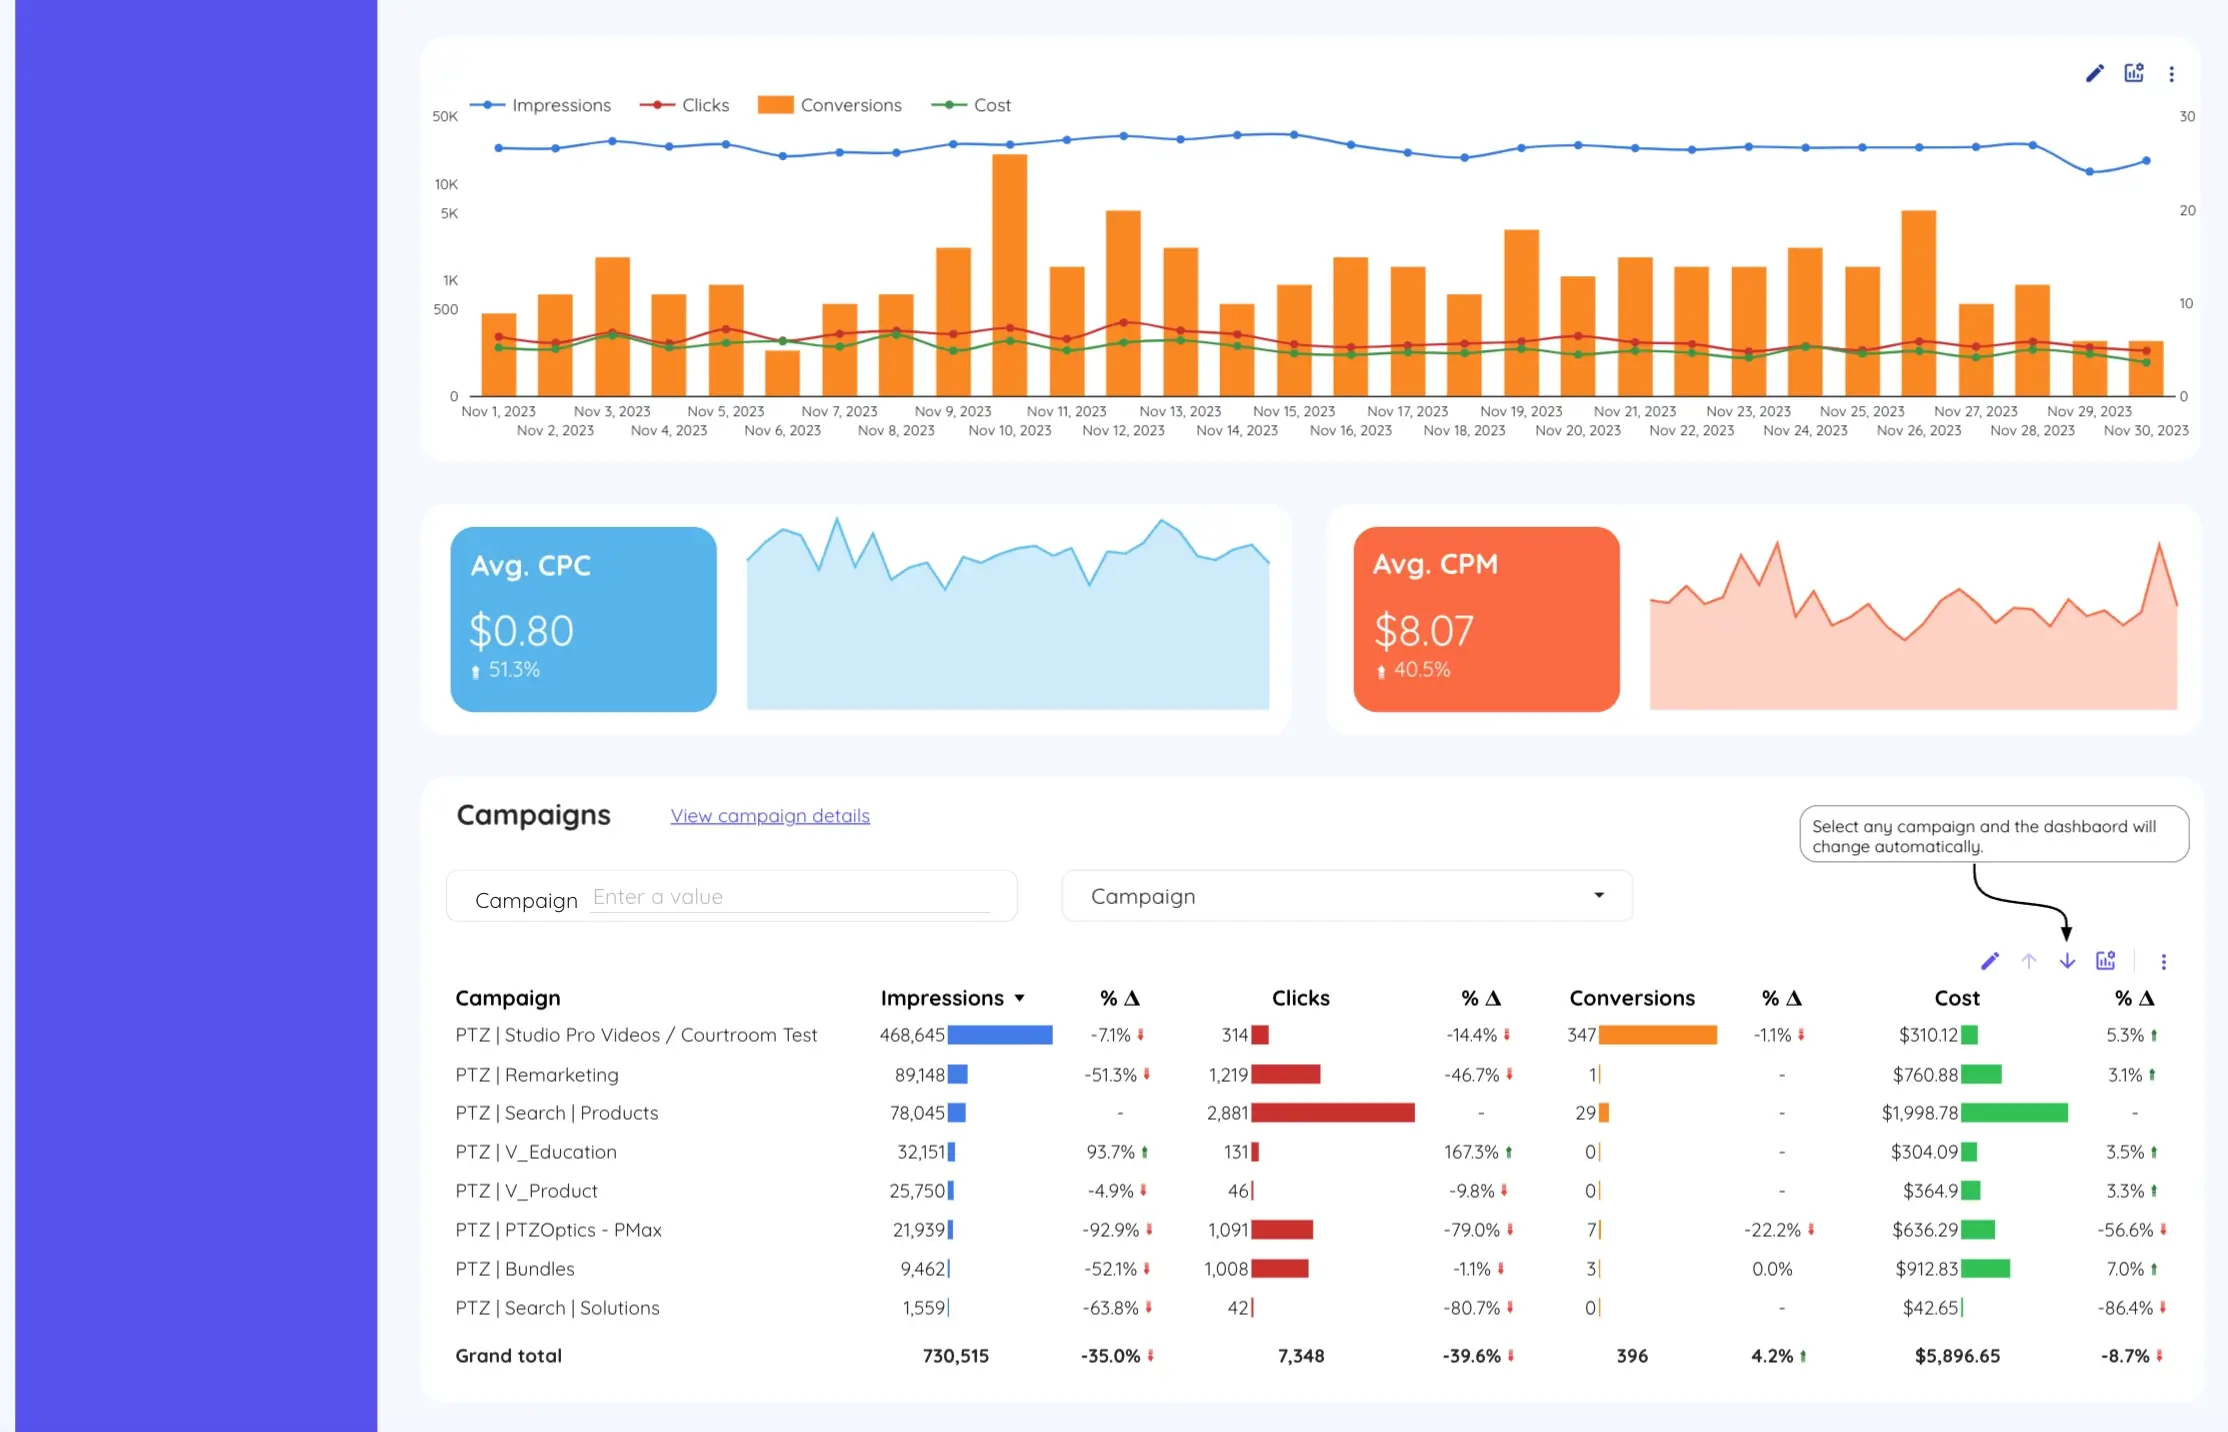
PPC campaigns fluctuate daily. Our dashboard includes a timeline analysis that allows you to:
- Compare search and display campaigns over time.
- Identify seasonal trends that impact ad performance.
- Adjust bidding and budget allocations based on real-time performance.
This ensures that optimizations are based on trends, not just static monthly reports.
Final Overview: The Full Picture in One Dashboard
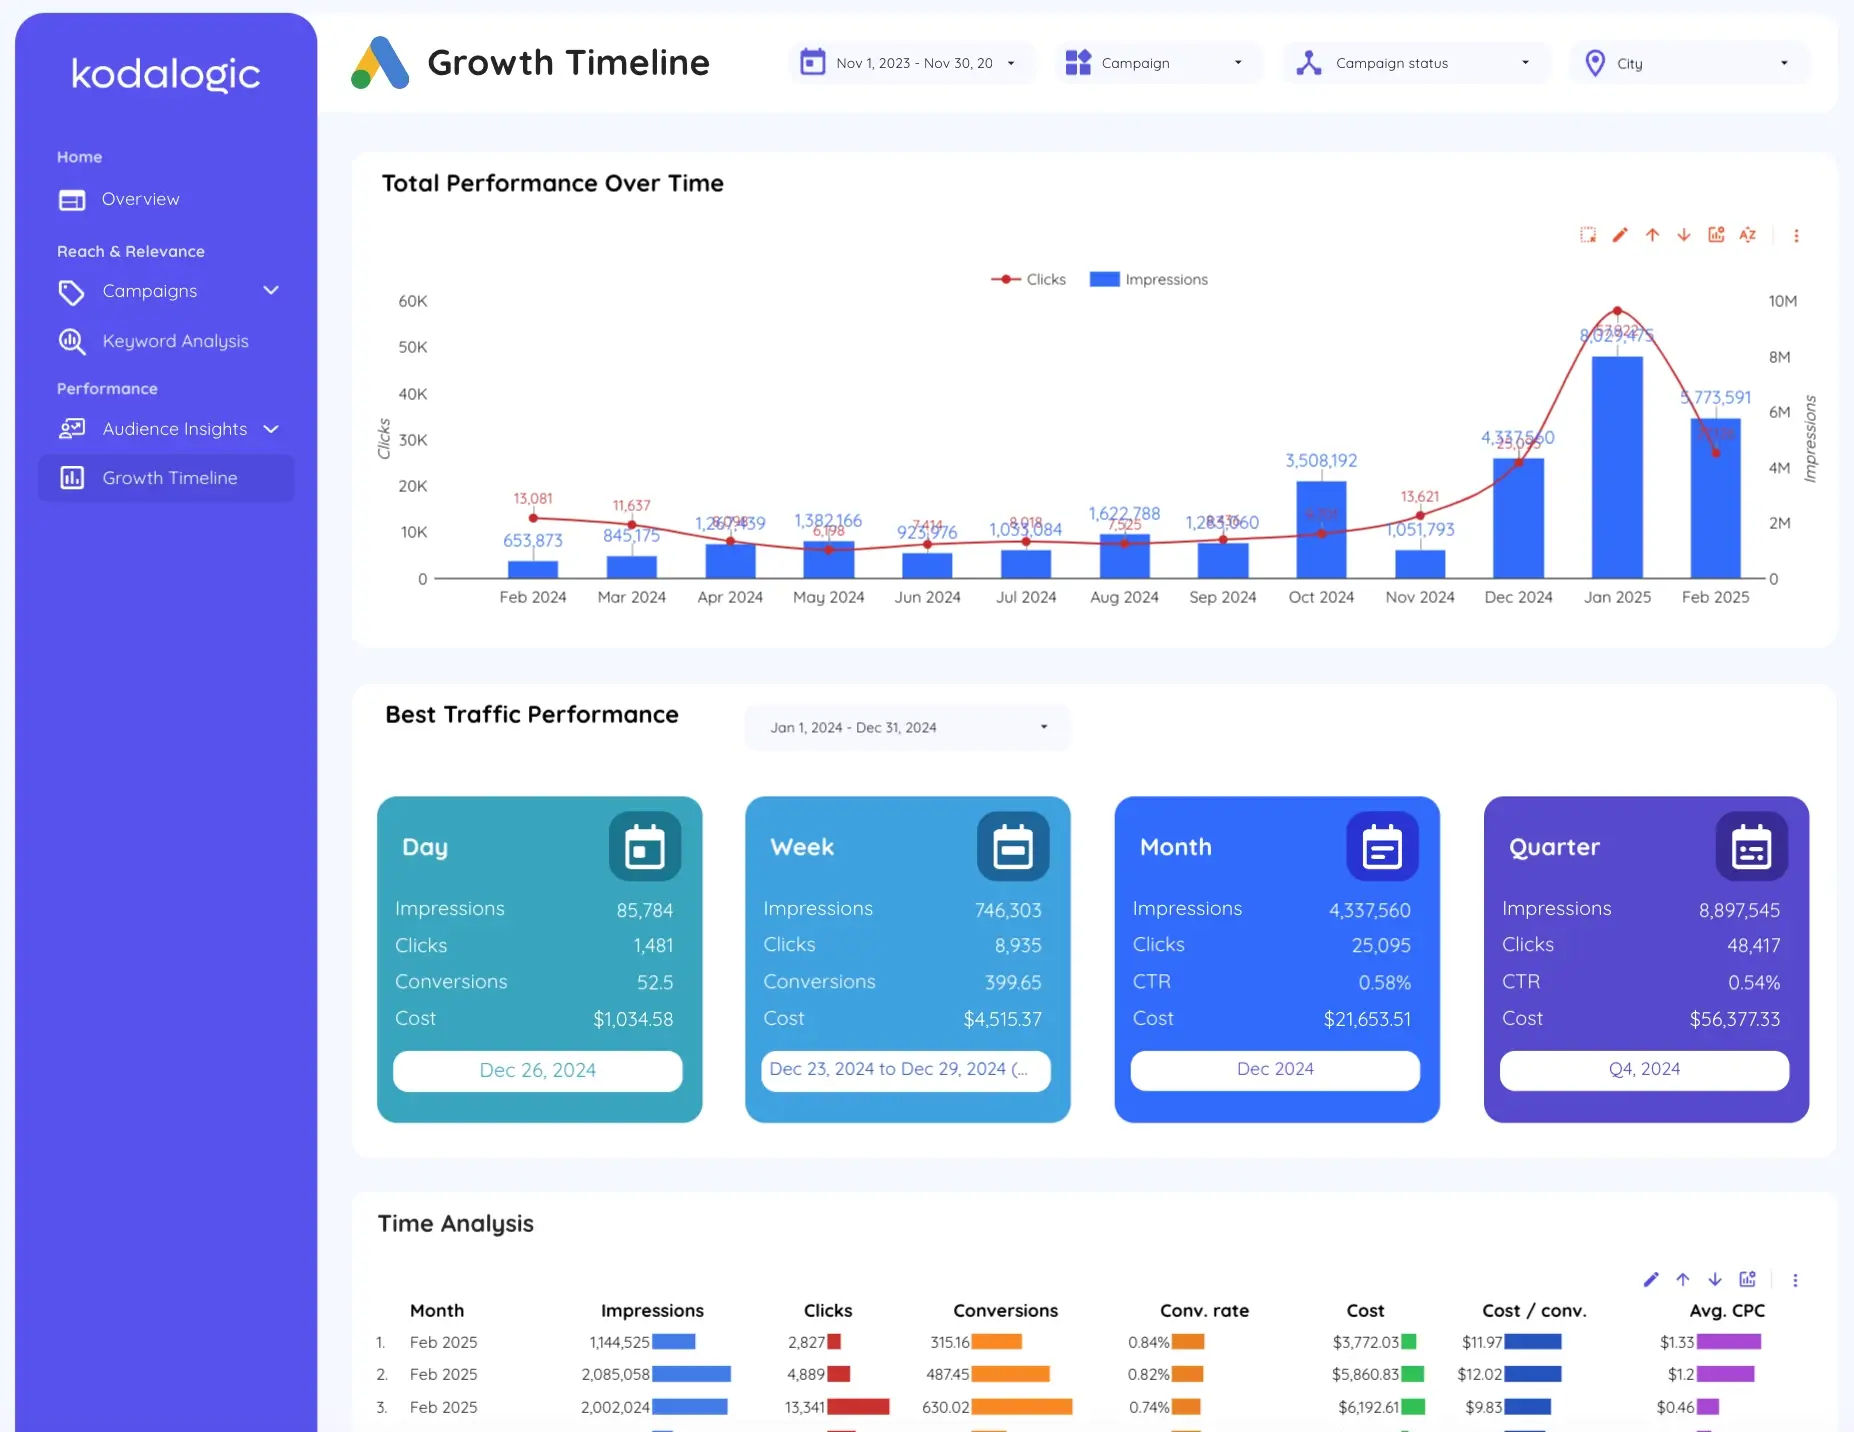
All these insights come together in the Overview Page, where you get:
- Key campaign metrics in a single view.
- Customizable reports for clients and internal teams.
- An intuitive layout that simplifies decision-making.
Instead of wasting time navigating Google Ads, you can spend more time optimizing campaigns.
The Next Step: Automate and Simplify Your PPC Reporting
If you’re tired of manually creating reports and struggling to analyze Google Ads data, it’s time to switch to a Looker Studio dashboard.
- Instant campaign insights without navigating Google Ads.
- Automated reports that save hours every month.
- Better decisions with clear, structured data.
Get the Google Ads Dashboard and optimize your PPC strategy today.