20 of March of 2025
Why we built Kodalogic: two hundred dashboards, one repeated problem

Isaac Correa
Productivity & Automation

Between 2022 and 2024 I built more than two hundred Looker Studio dashboards for clients, one at a time. Every one of them started from the same blank canvas. This is what my brother and I did about it.
I spent two years building Looker Studio dashboards for other people, one commission at a time. Between December 2022 and November 2024, working freelance under the name akurate, I delivered more than two hundred of them and collected 107 client reviews, every one of them five stars. Counting the work that never went through a marketplace, it is closer to four hundred.
I am telling you the number because of what it does, not because it is impressive. Two hundred is enough repetitions to stop seeing individual clients and start seeing the shape they have in common. This post is about the shape, and about what my brother and I decided to do with it.
The same forty minutes, two hundred times
Every commission started the same way. The client had opened Looker Studio — Google renamed it Data Studio, and half the industry still calls it both — because the product page promises reporting made easy. What they found was an empty page and a button that says Add data.
So they hired me. And the first forty minutes of every single job were the same forty minutes: connect GA4, connect Search Console, connect Google Ads, notice that the Ads connector attributes a conversion to a different date than GA4 does, decide which of the two numbers this particular client is going to be shown, and then lay out roughly the same eight charts I had laid out the week before for somebody else.
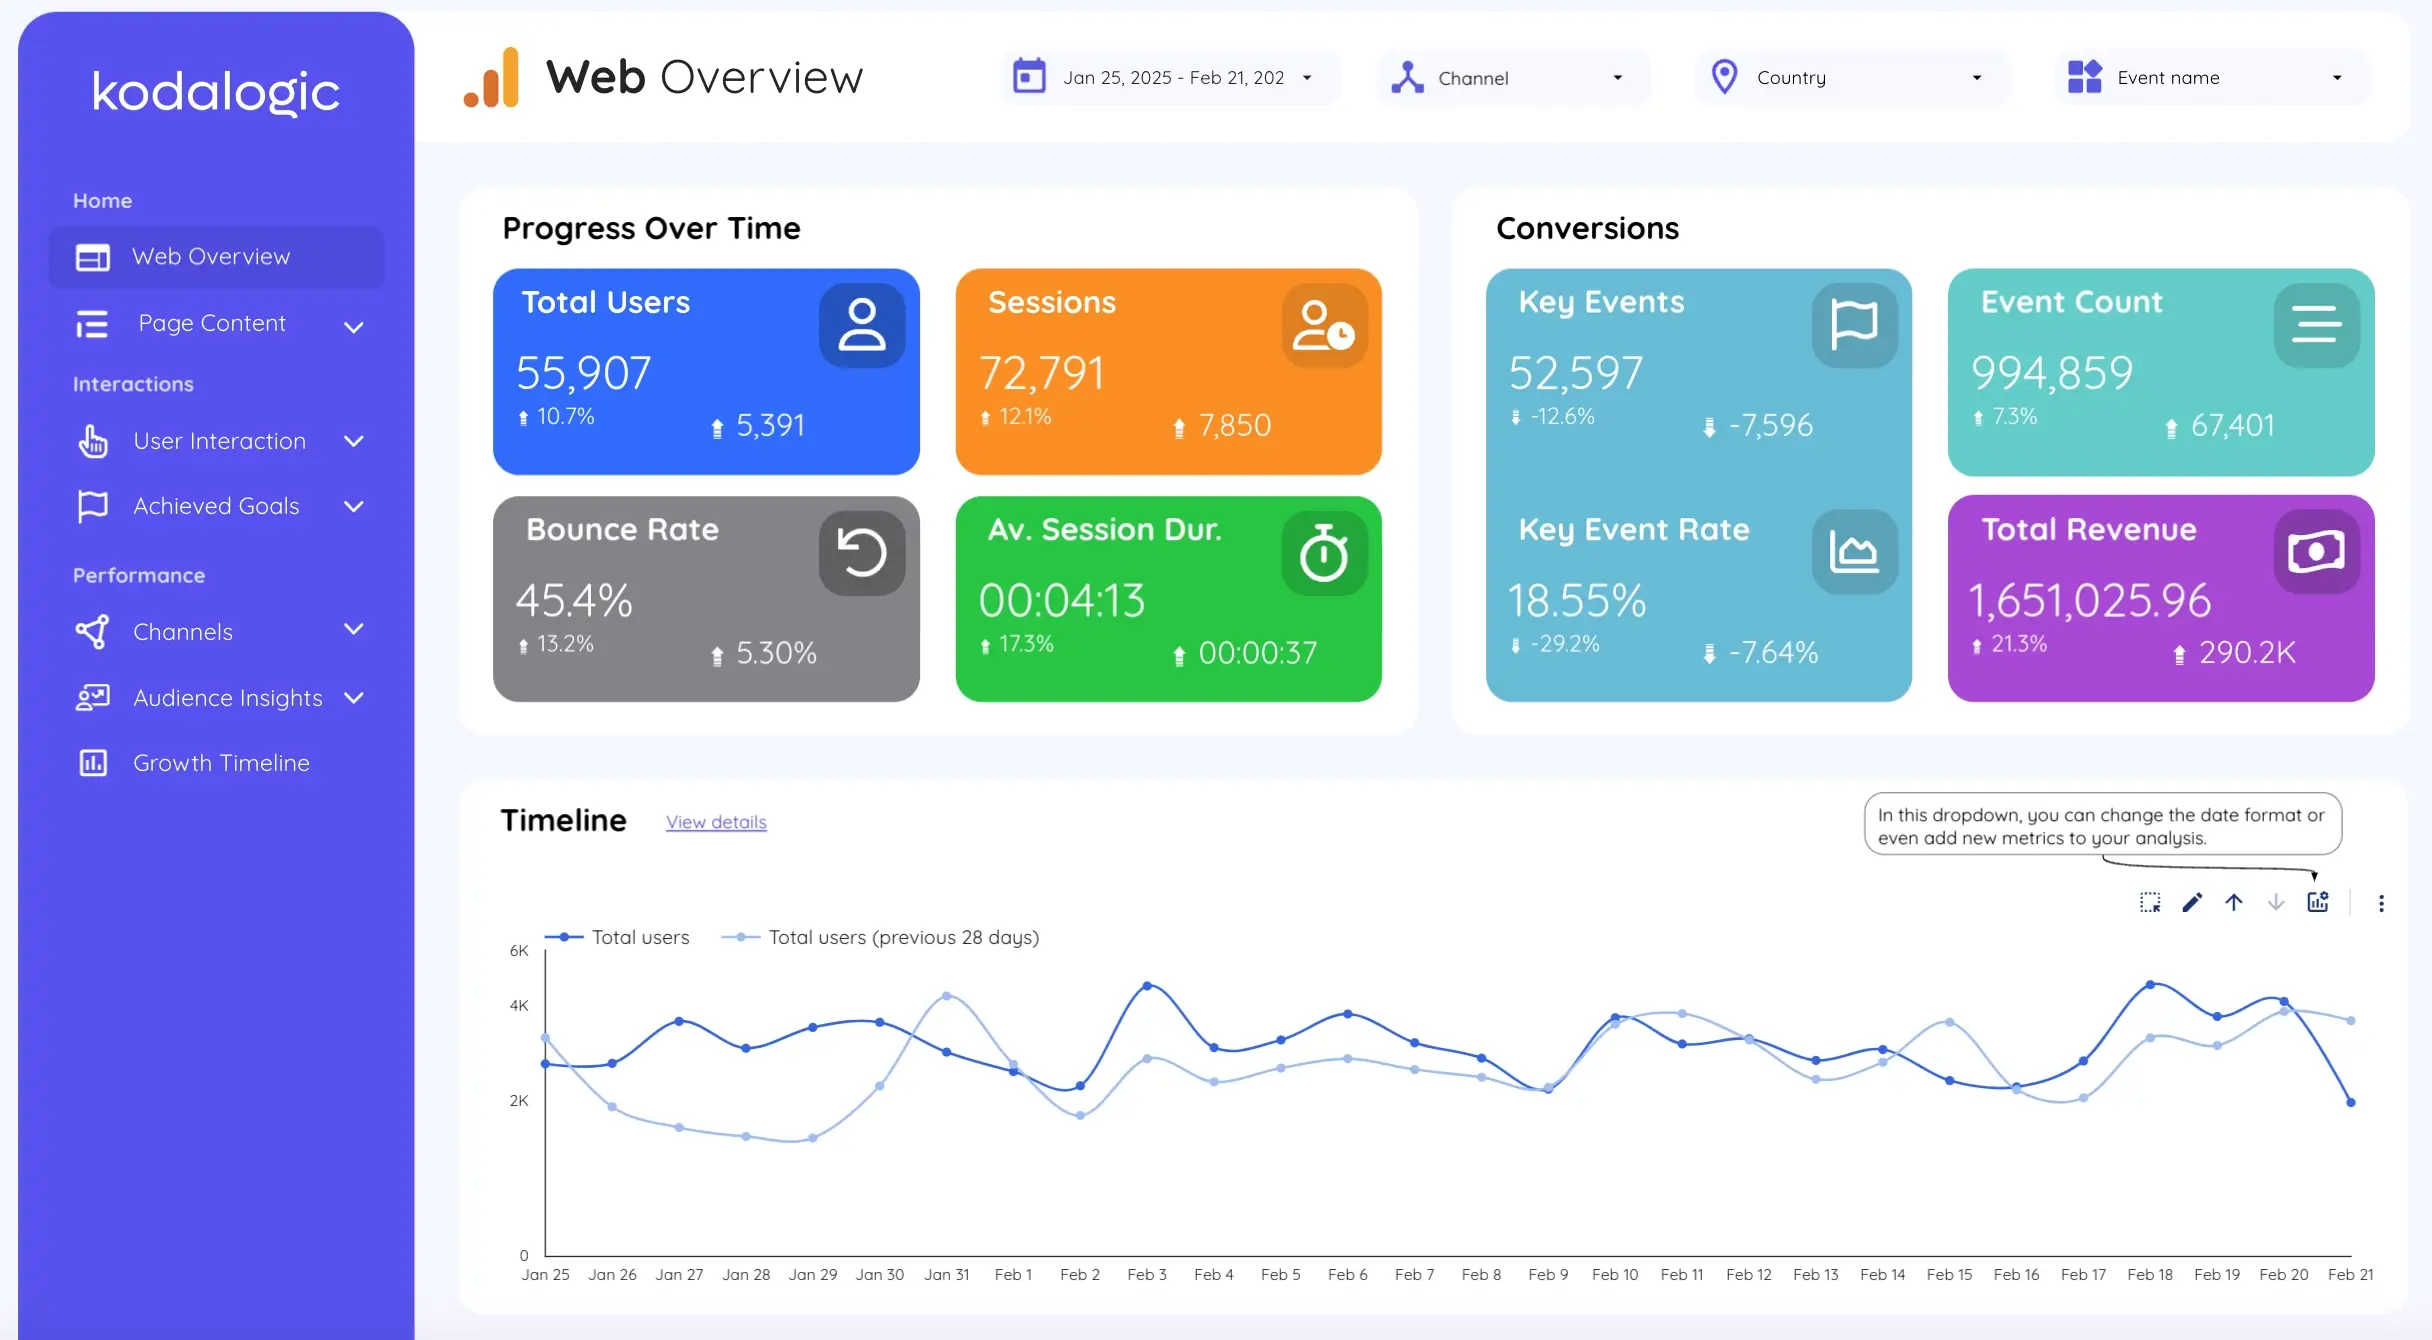
The part that stayed with me came after delivery. Once the thing was built, the client would ask the question that actually mattered: is this good? A dashboard on its own never answers that. It shows you that a number moved from 4.1 % to 3.6 % and leaves you to work out whether you should care, which is exactly the work they were trying to buy their way out of.
The tool was never the problem
I want to be fair to Looker Studio, because most posts on this subject are not. It is free, it connects to the Google products you already pay for, it refreshes on its own, and you can hand a client a live link instead of a screenshot pasted into a slide. For what it does, there is not much competition.
The problem is where it starts you. A blank canvas plus a data connector is the right tool for the small minority who need to build something nobody has built before. It is the wrong tool for everybody else, who needs the report that already exists in every agency on earth: how the site did last month, where the traffic came from, what the ads cost, which pages lost ground.
Nobody should have to invent that report. It has been invented. It gets reinvented, expensively and slightly wrong, several thousand times a week.
What we built instead
Two hundred commissions is a line on a CV. What the work actually gave me only shows up with repetition: when you watch the same problem arrive two hundred times, it stops looking like a coincidence and starts looking like a structure. In September 2024 my brother Daniel and I founded Kodalogic on the conclusion that follows from it. If two hundred clients need the same report, building it two hundred times is a poor way to spend two hundred people’s money. Build it once, properly, and hand it over finished.
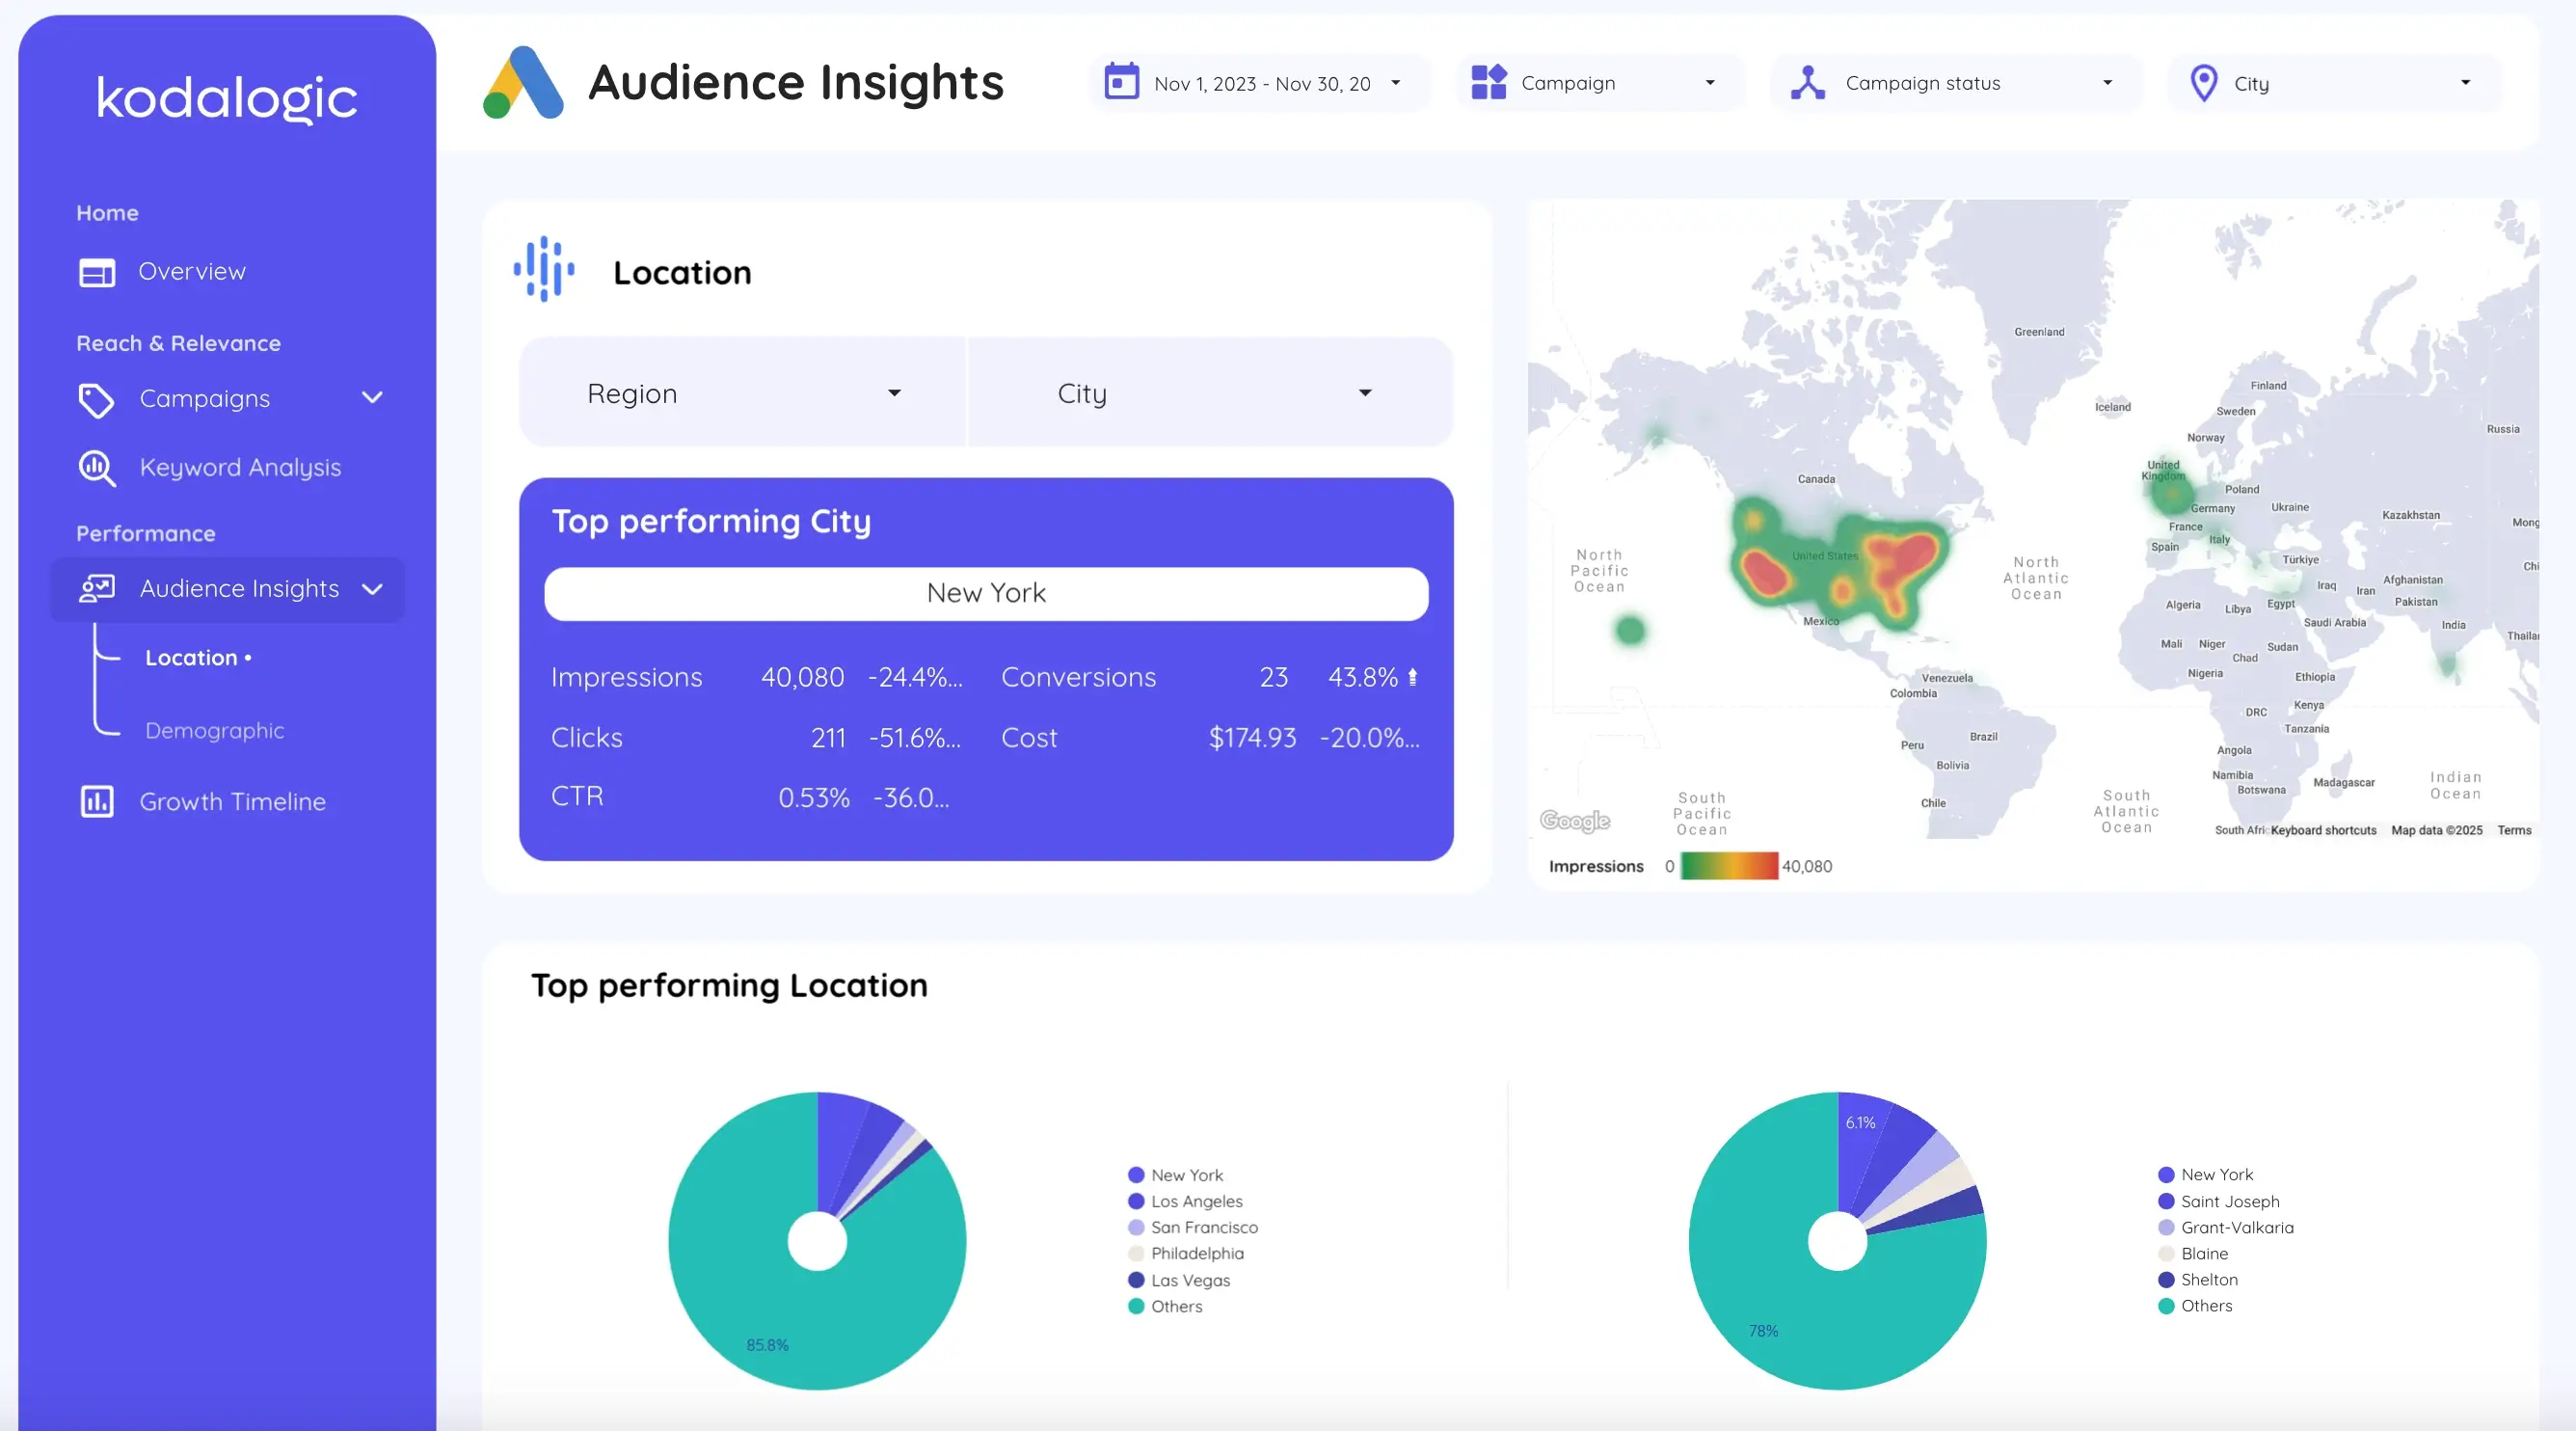
So that is what the six dashboards are. You buy one, you connect your own GA4, Search Console or Google Ads account, and the report fills with your data. There is no blank canvas, no connector archaeology, and no argument about which conversion number to trust — that decision is already made inside the template, and written down.
The part I care most about is the last one. Each report explains its own numbers in sentences, next to the chart, so that the client who asks is this good? gets an answer without you having to be in the room. That is the difference between a dashboard and a report, and it is the reason we are not just another pack of templates.
Which one fits your situation
The six are deliberately not variations on a theme. Each one answers a different question, and the honest way to choose is to pick the question you are actually being asked.
- Google Analytics 4 Dashboard — pick this if you want to know what happened on the site last month and where the people came from, and nothing else.
- Google Search Console Dashboard — pick this if your question is about search: which queries you rank for, which pages lost positions, and when it started.
- Google Ads Dashboard — pick this if you are spending money on ads and the argument you keep having is about what it bought.
- Web & SEO Dashboard (GA4 + Search Console) — pick this if you need traffic and search in the same report, because the answer to one is usually in the other.
- GA4 + Google Ads Dashboard — pick this if you want the spend and the behaviour side by side: what the click cost, and what it did after it landed.
- All-in-One Marketing Dashboard — pick this if you report to somebody who wants one document, not four. It contains all of the above.
All six are bought once, kept for good, and updated when Google changes something underneath them. You can see the current prices and a live demo of each on the templates page, and what buyers said afterwards on the reviews page.
What I would tell you even if you buy nothing
If you are going to build it yourself anyway, three things are worth knowing before you start, because they are what cost me the most time across those two hundred jobs.
- Decide your conversion source before you build anything. GA4 and Google Ads will disagree, they are both right by their own definition, and a report that quietly shows both is a report that will be argued with every month.
- Date ranges are where dashboards break. A control that defaults to “this month” makes every chart mean something different on the first of the month than it did on the thirty-first.
- Write the interpretation down. If the report cannot say what a change means, somebody has to say it, and that somebody will be you, every month, forever.
If you would rather talk it through than read about it, I answer these myself. Book a call and bring your actual reporting problem; I have probably built it.
— Isaac Correa, co-founder of Kodalogic. More about me and the work behind this.