Kodalogic templates · Feature
What is Smart Interpretations?
Smart Interpretations is the feature in Kodalogic’s Data Studio (formerly Looker Studio) templates that reads the connected data and writes the analysis as plain-language text inside the report, what changed, where, and what it suggests, instead of leaving the reader alone with the charts.
- Live data
- Smart Interpretations
- “Clicks rose 17%, driven by brand queries”
- Reader
Written on every refresh, in plain words.
The report reads the numbers and writes the sentence under the chart.
- Data source
- Kodalogic templates
- Type
- Feature
Why it matters
It runs on the report’s own data source, so the written analysis updates with the numbers.
How to read it
In practice this addresses the last mile of reporting: charts show what changed, but someone still has to write what it means. Automating that written layer removes the step agencies most often do manually each month, and keeps the narrative consistent with the numbers because both come from the same source. The name is Kodalogic's own; generic Data Studio has no built-in feature that writes narrative analysis of the connected data.
In a Data Studio report
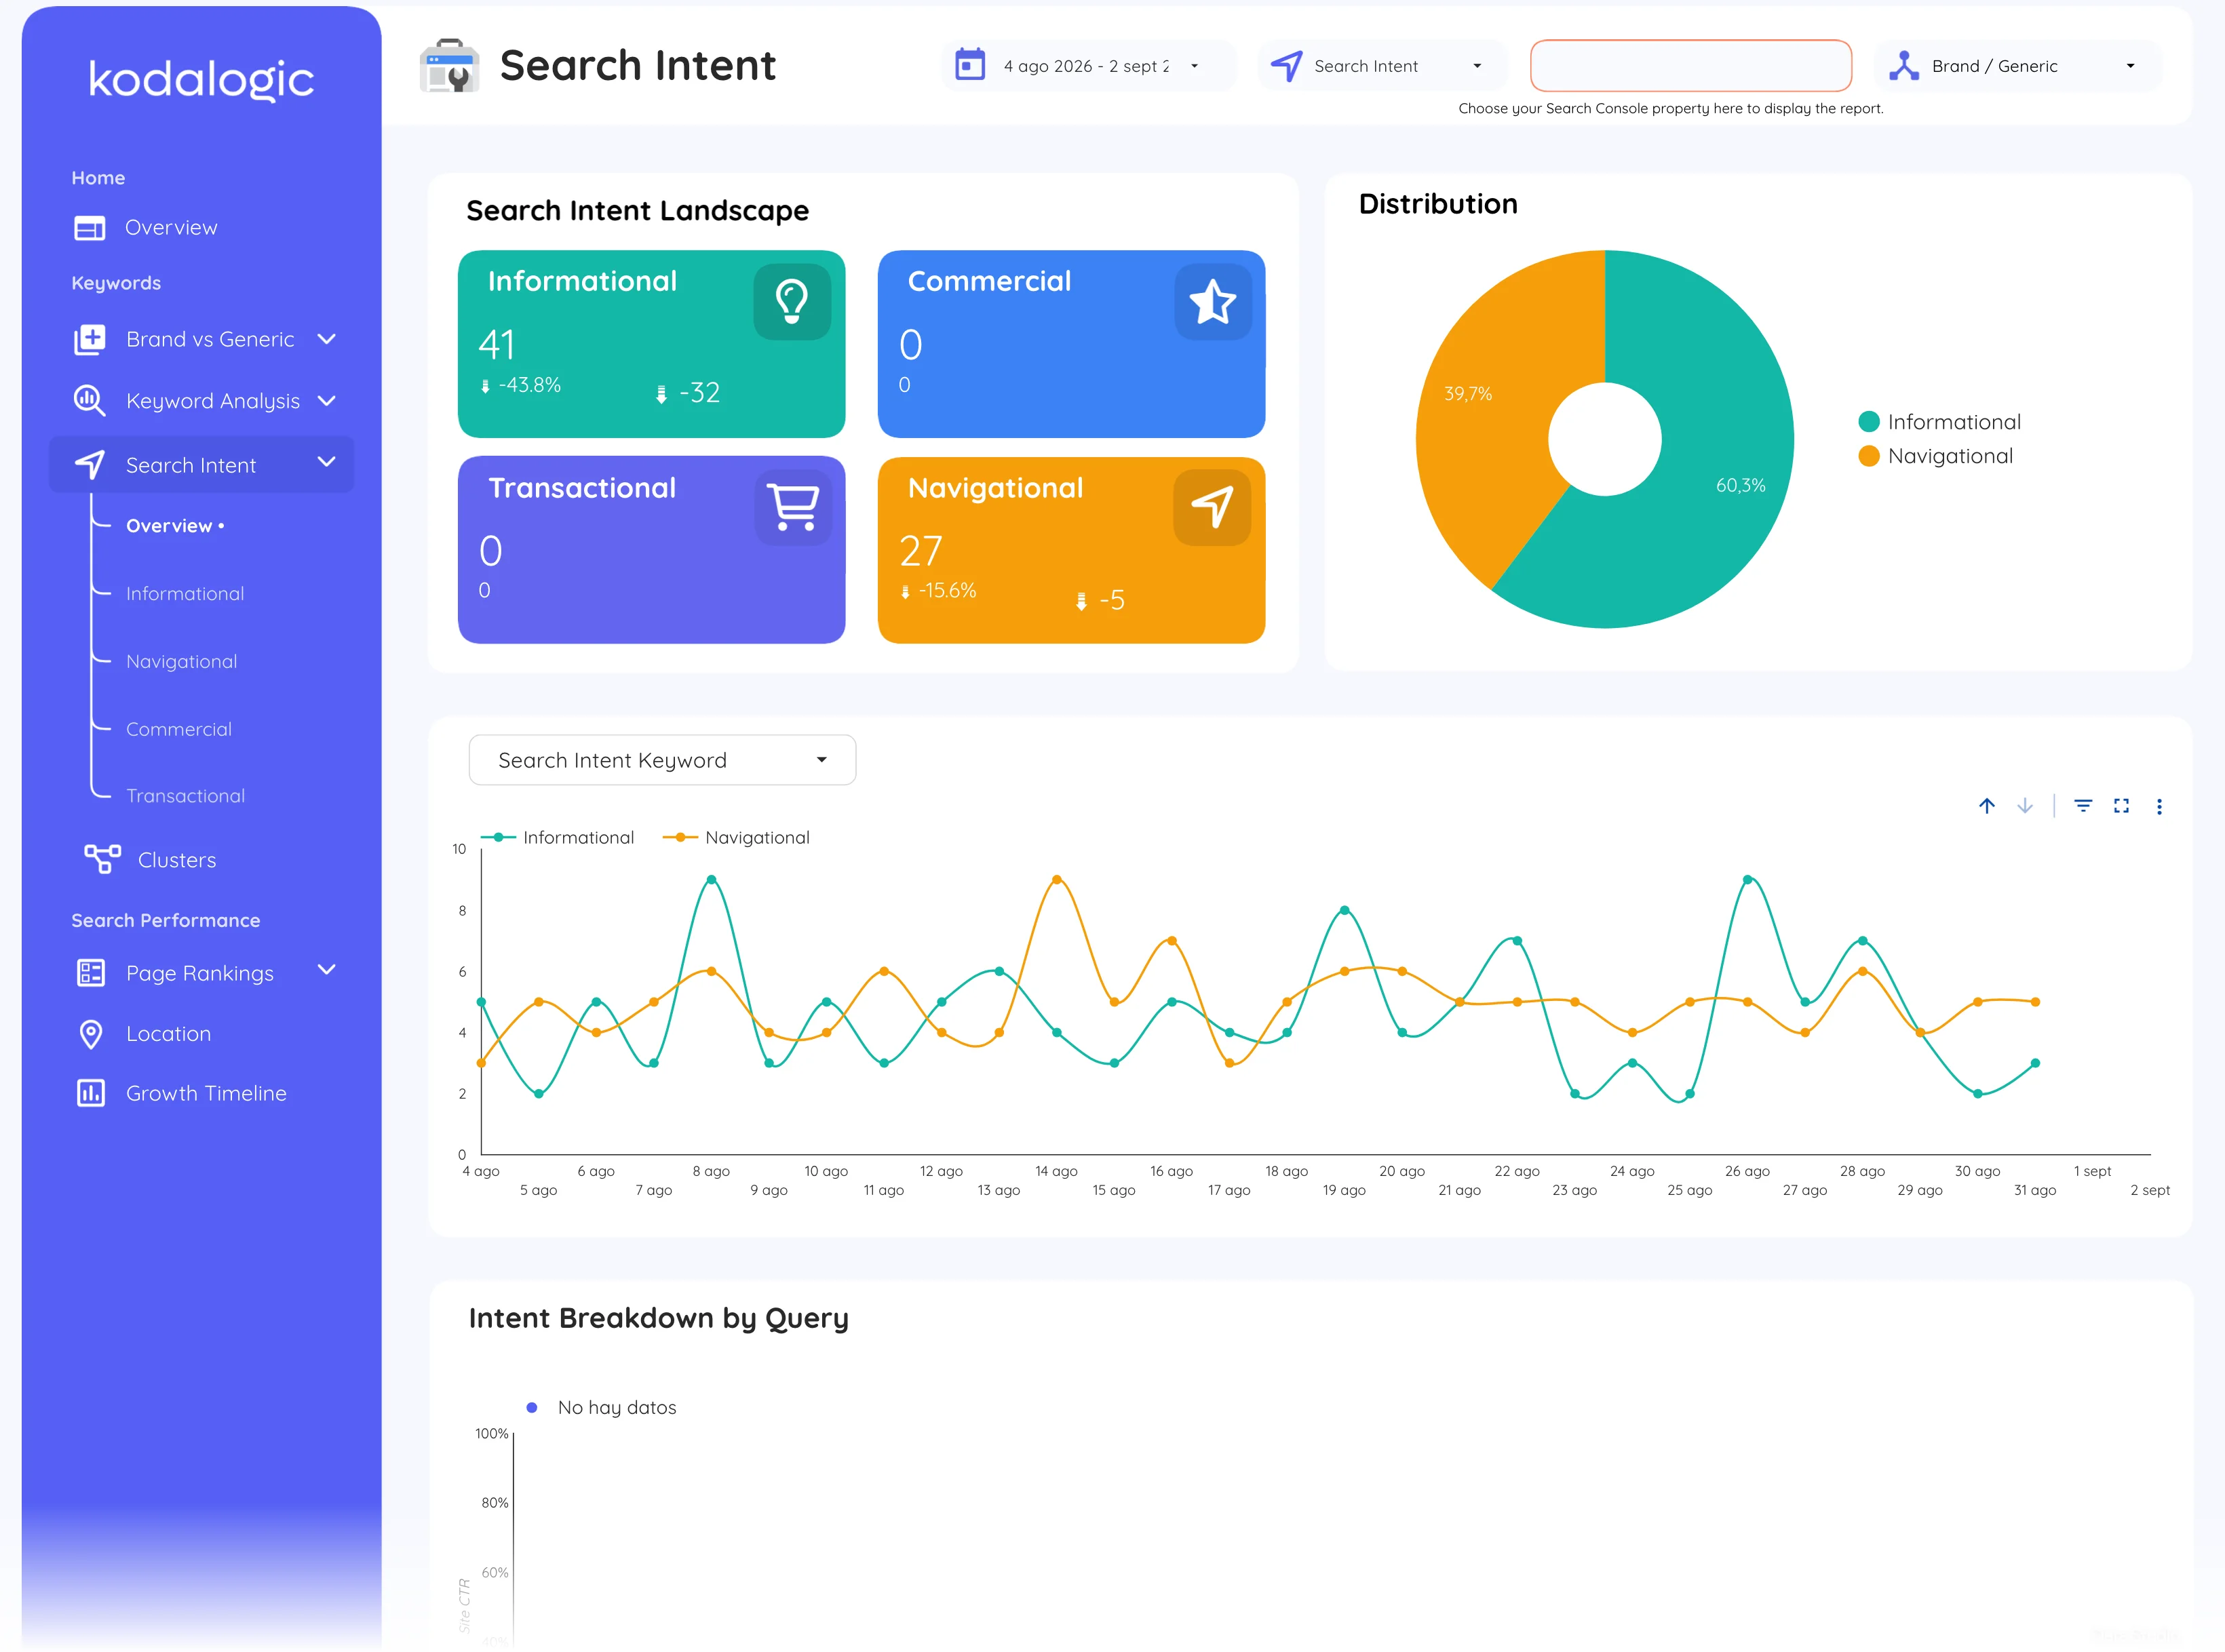
Inside the report it appears as text panels beside the charts: each section reads its own metrics and states what changed and what it implies, in plain sentences. Because the text is computed from the connected data source, a client opening the report in March reads March's analysis without anyone rewriting it.
Where to find it in Google
Not in Search Console: it is the written analysis the Kodalogic templates add on top of the Search Console data, on the brand, keyword and intent pages.