Customizing your Data Studio report template
Your copy is an ordinary Data Studio (formerly Looker Studio) report that you own: logo, theme colours, pages and every chart are editable with the standard editor, and nothing you change touches the original.
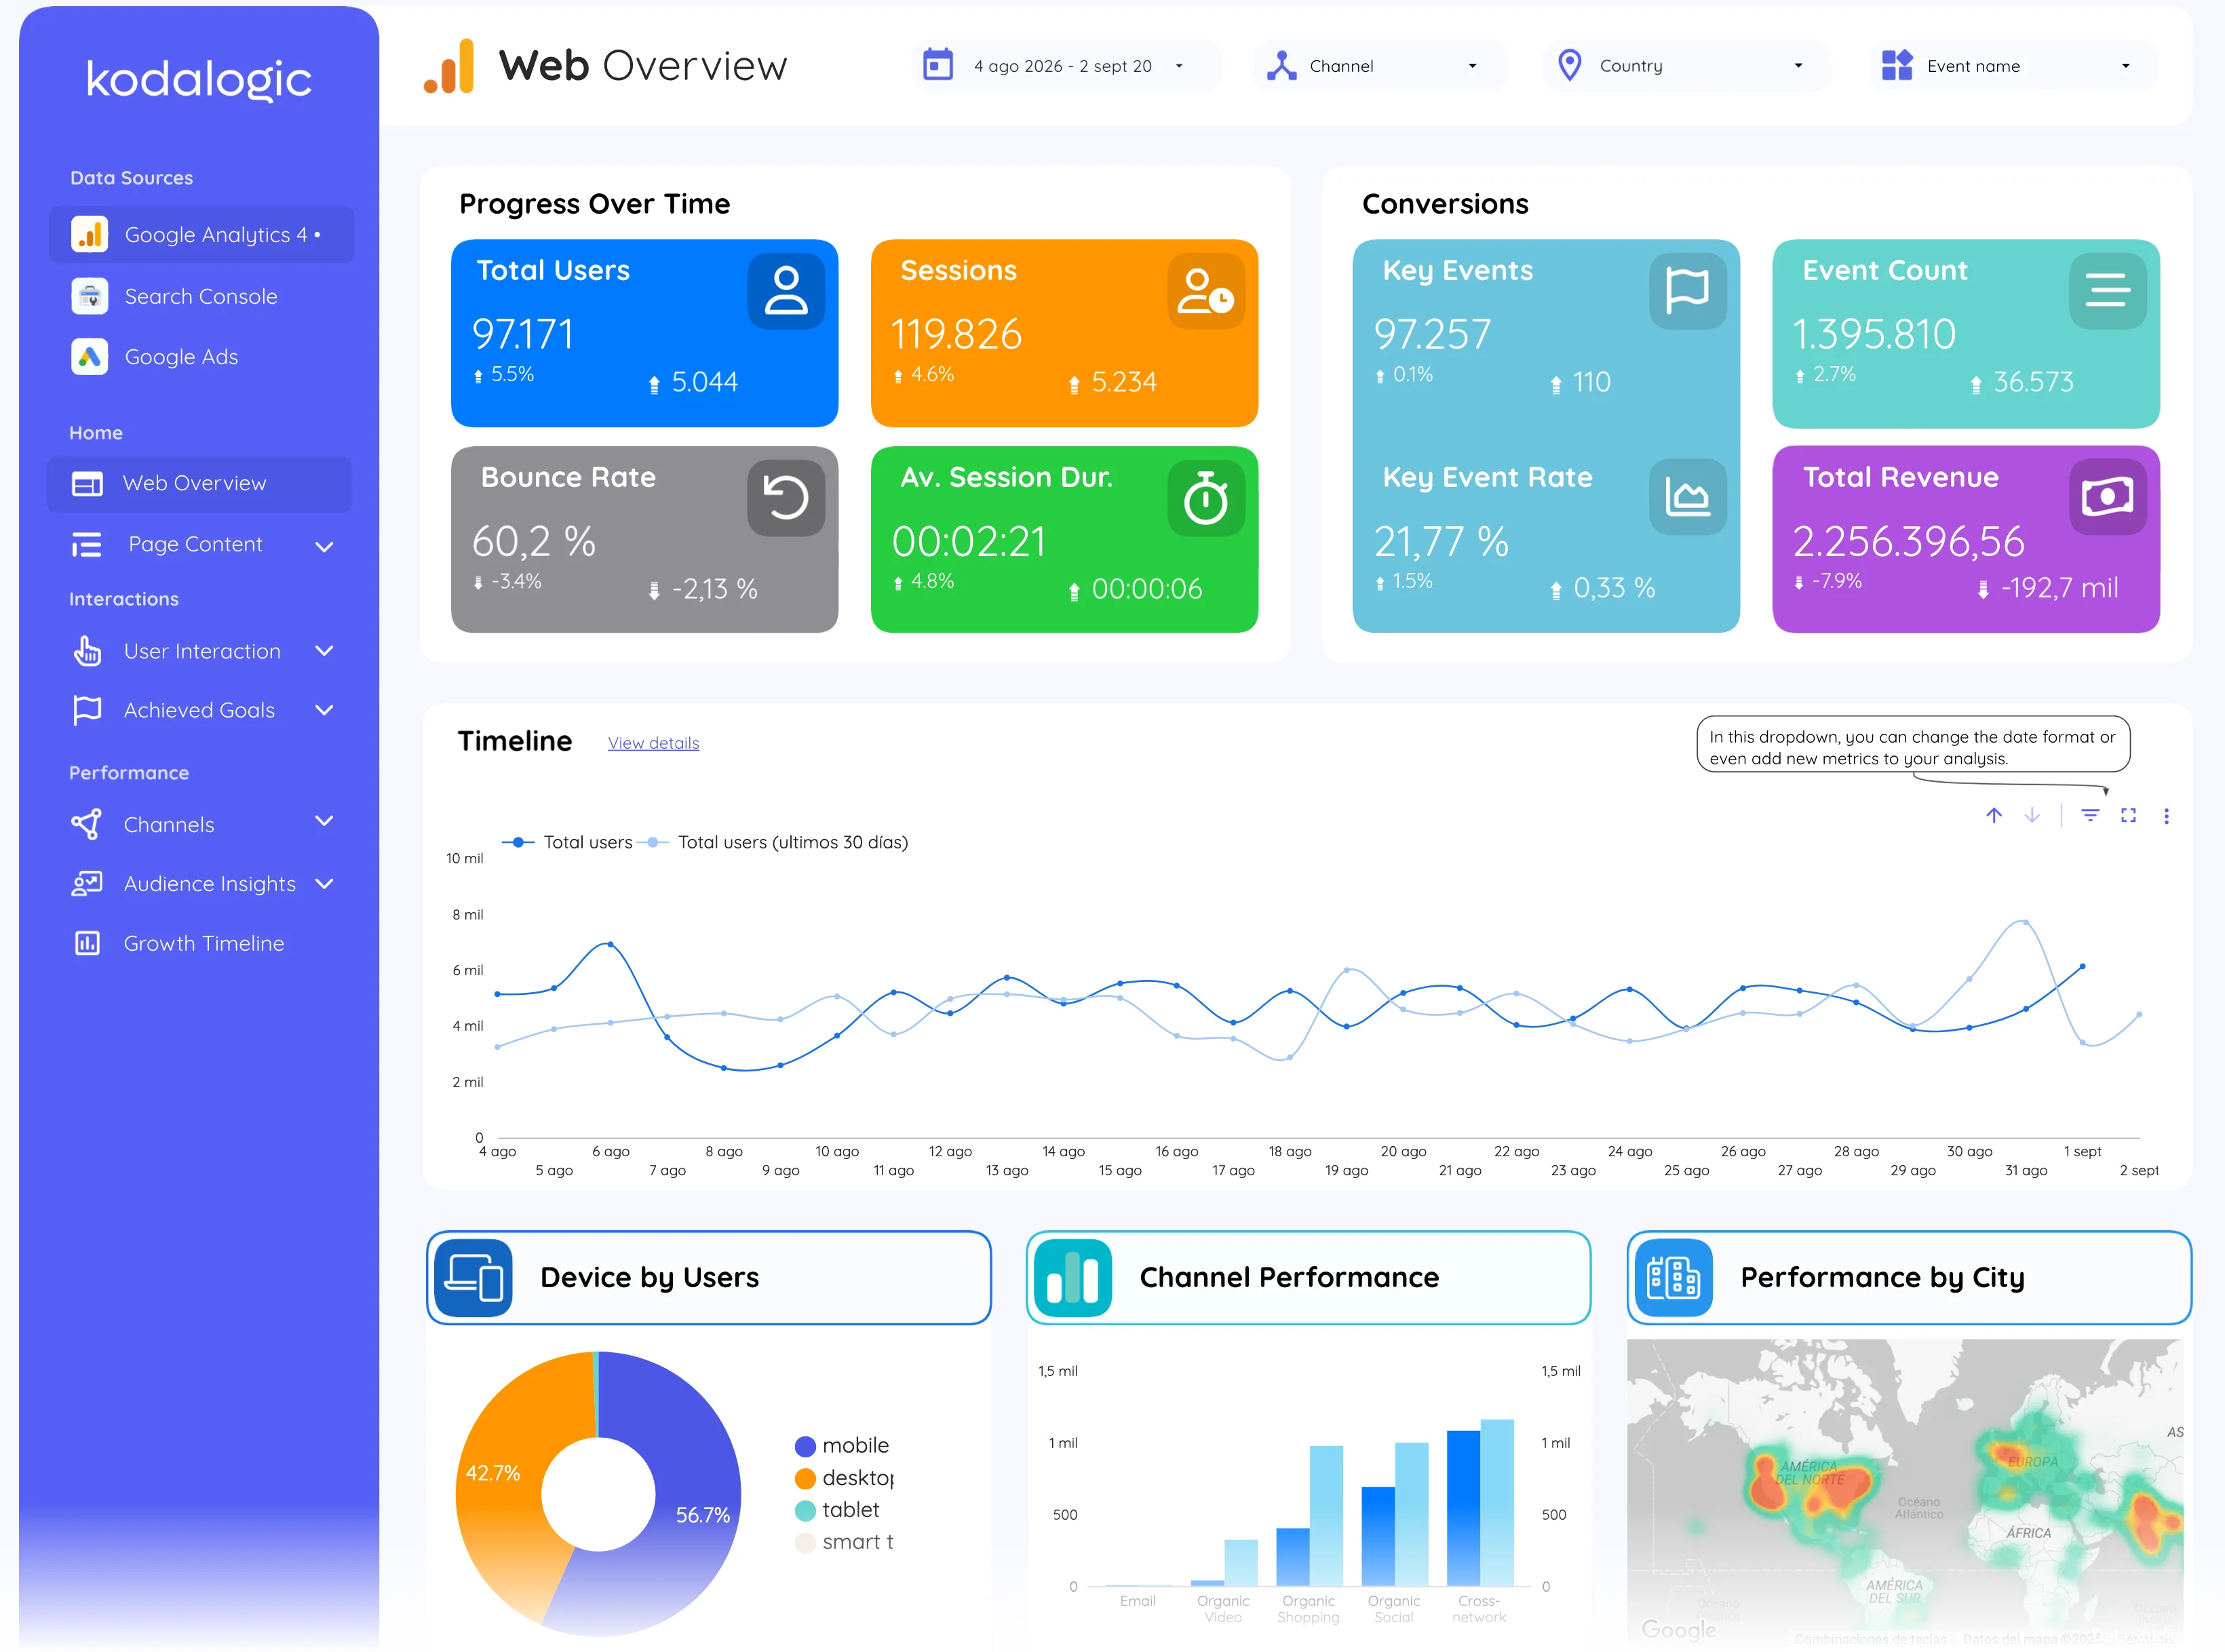
The three-click white-label
- 01
Logo: click the logo in the sidebar, open the Data tab on the right and replace the image with your own or your client’s. Every page shares the sidebar, so it changes everywhere at once.
- 02
Colours: open Theme and layout in the toolbar. The theme sets the sidebar, the chart palette and the accent colour of the whole report; change it once and every page follows.
- 03
Pages: open the page list and hide the pages your client does not need. Hidden pages stay in the report, out of the viewer’s sight, and come back with one click.
Two edits worth doing before the first client sees it
Set the report’s default date range to the period the client cares about (last month, last quarter). It is the first thing they see and the difference between a report that looks prepared and one that looks generic.
Rename the pages to their vocabulary. “Search overview” may be “Organic performance” in their world. Page names are the report’s table of contents, and a client reads them before any chart.
Nothing you do can break the original
Edits live only in your copy. There is no sync back to us and no update that can overwrite your work. If you break something while editing, Data Studio keeps a version history under File, then Version history, the same as a Google Doc: restore an earlier state without asking anyone for a new copy.
Check
The sidebar shows the right logo on every page.
The default date range opens on the period the client expects.
The pages the client should not see are hidden, not deleted.
Read the full guide
This doc covers your copy of the template. These guides cover the topic in full.
- Put your client logo and colours on a Data Studio reportThe full branding pass with screenshots: theme, palette, fonts and the logo in every page.
- 15 Data Studio tips for dashboards that workThe edits beyond branding: filters, calculated fields, blending and the styling rules that keep a page readable.