The shop numbers, with the funnel already drawn.
Revenue, purchases and what leaked between viewing a product and paying for it, from your own GA4 property, on one page a client can read.





4.97 from 100 reviews in 27 countries: read them
What an ecommerce report is
An ecommerce report in Data Studio (formerly Looker Studio) answers four questions a shop owner asks every week: what did we sell, who bought it, where did they come from, and where did the rest give up. GA4 holds all of it in its Monetization reports, but the funnel lives in one place, revenue by channel in another and landing pages in a third.
This template is the GA4 report with the ecommerce page in front: revenue, purchasers and items with their change against the previous period, the view-to-cart-to-purchase funnel drawn for you, and the channel and landing-page pages that say which traffic actually buys. It reads your property live with Google's own connector.
Who opens it
Shop owners
The weekly sales review on one page, without learning where GA4 hides the funnel.
Agencies running ecommerce accounts
One copy per client store, branded, shared as a link that updates itself.
Marketers with a paid channel
Revenue per channel next to the funnel: whether the campaign brought buyers or only visitors.
An ecommerce report, live: 14 pages on real data
The template itself, embedded from Looker Studio on demo data. Click through it here, or pick a page below. The orange field is where your own property goes once the copy is yours.
14 pages. These 12 do the work of an ecommerce report.
Each one photographed from the live template, with what it is for and the fields it reads. Every field links to its definition; every page opens in the live report above.
- Page 1 of 14
Web overview
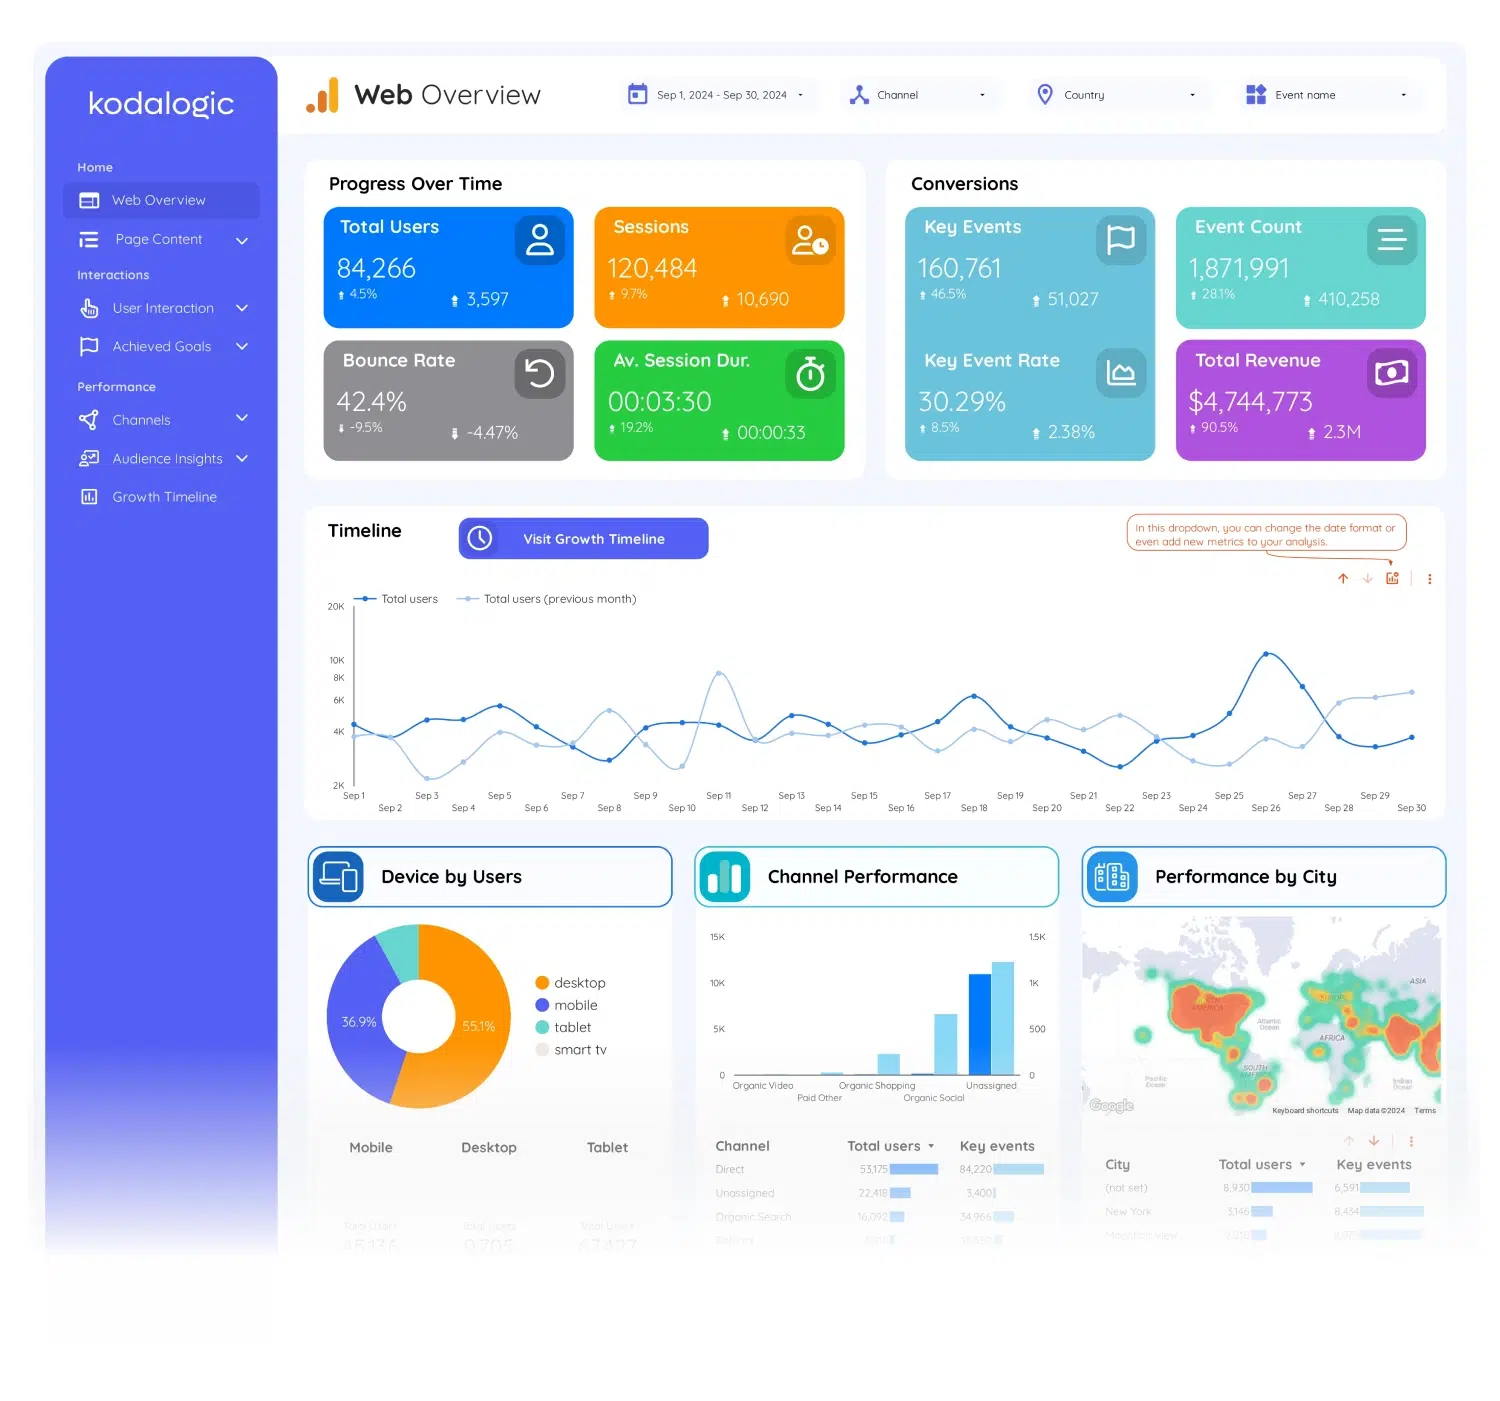
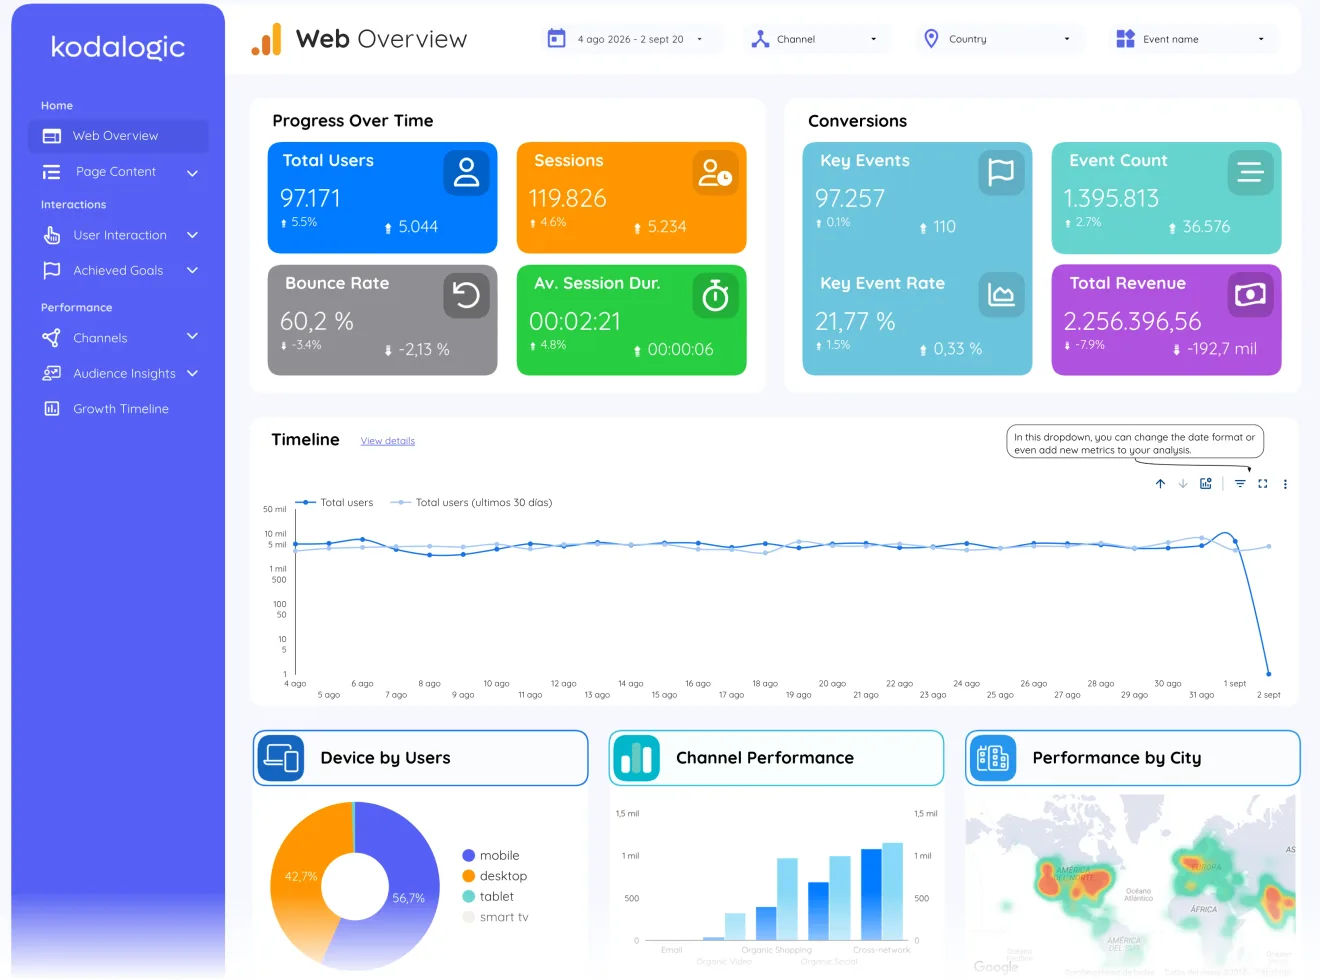
The eight headline numbers a client asks for: users, sessions, bounce and session duration on one side, key events, event count, key event rate and revenue on the other, each with its change against the previous period, over the device, channel and city splits.
Reads: Total Users · Sessions · Bounce Rate · Av. Session Dur. · Key Events
- Page 2 of 14
Page content
Every page ranked by views, sessions, bounce and key events, with page-path and page-title search boxes that find any URL in seconds.
Reads: Page Views · Pages / Session · Pages / User · Avg. Session Dur. · Views
- Page 3 of 14
Landing page
Sessions by landing page over time, the top landing pages by traffic, and a distribution chart that separates the pages that convert from the ones that just exist.
Reads: Sessions · Views · Bounce rate · Key events · Landing page
- Page 4 of 14
User interaction
Every GA4 event counted per user, and a funnel you assemble with the event selector: page_view to purchase, with the drop at every step, plus new vs returning users.
Reads: Event Count · Event per User · Total users · Active users · Events per session
- Page 6 of 14
Site search
Who uses your site search and what they type: users with search vs without, total searches with their trend, and the exact search terms with their events.
Reads: Users w/ Searches · Sessions · Total Searches · Av. Session Dur. · Searches
- Page 7 of 14
Conversions
Key events, event count, key event rate and total revenue with their trends, and every event ranked: add_to_cart and purchase get watched, not guessed.
Reads: Key Events · Event Count · Key Event Rate · Total Revenue · Event name
- Page 8 of 14
E-commerce
The shop numbers with the funnel already drawn: how many people saw a product, how many added it, how many paid, and what leaked at each step.
Reads: Total Purchasers · Items Purchased · Key Event Rate · Total Revenue · Item revenue
- Page 9 of 14
Channels
Every acquisition source compared on the same three columns, with the organic-against-paid area chart above them. Which channel brought them, and which channel brought the ones who mattered.
Reads: Total users · Sessions · Bounce rate · Key events · Session key event rate
- Page 10 of 14
Organic
The organic slice on its own: sessions, users and key events per organic channel with their deltas and a page-path filter: the practical answer to GA4’s “(not provided)” organic keywords gap.
Reads: Total Users · Sessions · Bounce Rate · Av. Session Dur. · Key events
- Page 12 of 14
Location
Country, state and city performance on a session heat map with top cities by users and key events: select any state and the page rebuilds around it.
Reads: Sessions · Total Users · Bounce rate · Key Event Rate · Key Events
- Page 13 of 14
Demographic
Age and gender, crossed: the top-performing segment, male and female splits with sessions and key events, and the 18-24 to 65+ distribution.
Reads: Sessions · Total Users · Bounce rate · Key Event Rate · Key Events
- Page 14 of 14
Growth timeline
The long view: twelve months of sessions and users side by side, with your best day, week, month and quarter picked out automatically.
Reads: Sessions · Total users · Key Events · Bounce rate · Views
The sections an ecommerce report needs, and the questions each one answers
Revenue and purchases
Total revenue, purchasers, items purchased and average value, each against the previous period.
- What did the shop earn this period against the last one?
The funnel
Viewed, added to cart, checked out, purchased, with the drop at every step drawn for you.
- Where do people drop between viewing a product and paying?
Channels that sell
Which sources bring buyers, not just visitors: revenue and key events per channel.
- Which channels bring buyers, not just traffic?
Pages that convert
Landing pages ranked by the sessions and purchases they actually produce.
- Which landing pages turn visits into purchases?
The template, in numbers
- Best for...
- Ideal for beginners and core analytics users.
- Traffic Overview
- User metrics, sessions, and engagement.
- Conversion Tracking
- Basic tracking: goals and events.
- Audience Insights
- Detailed audience segmentation and data.
- Keyword Performance
- -
- Search Engine Optimization
- No SEO insights available.
- Acquisition Channels
- Organic traffic analysis.
- Geographic Data
- Shows audience location data.
- User Engagement Metrics
- User metrics: sessions and engagement.
- Setup Time
- Fastest setup (1 min).
Which template to buy for an ecommerce report
Built for this report
Google Analytics 4 Dashboard for Data Studio
Your GA4 data, structured the way marketers actually need it — not the way Google Analytics 4 displays it.
$129
One-time payment, lifetime updates, unlimited copiesWhen another one fits better
When the shop runs Google Ads and the question is what the paid clicks bought.
When organic search and ads both matter and the report has to cover the three.
- Compare all six side by side
What buyers say about working with kodalogic
- ★★★★★
w_charlie, United States of AmericaI needed a looker studio dashboard for a business I work with. Kodalogic delivered an awesome dashboard quickly to the specs I requested. They had Google Ads and Analytics connected and the dashboard built quickly. When I requested changes he was very attentive and cooperative. I highly recommend Kodalogic, great job brother!
- ★★★★★
gx2000, United States of AmericaI continue to work with Kodalogic. They have a great understanding of analytics, and I'll keep hiring them for connections and analysis work. I'm looking forward to exploring more of their services. They're also very communicative and helpful, with excellent English skills via email, which has been very supportive.
- ★★★★★
yashbodane, IndiaHighly Recommended! Kodalogic will help you create analytics reports that are beautiful and easy and understand. He has in-depth knowledge of Ga4, Looker and tag manager. Anyone looking for reports or dashboards should definitely contact Kodalogic and work with him.
All 100 reviews, with the country and date of each one.
Read the deep dive
- GA4 dashboard: automate reports in minutes →
The full setup walkthrough for this template, from connecting the property to the first client-ready report.
- Mastering GA4 reporting: custom events and dashboards →
How the event model behind the Conversions and User interaction pages works, and how to make your own events show up here.
- How to improve your engagement rate in GA4 →
What the engagement numbers on the overview page actually mean, and what moves them.
- Master GA4 quota limits with Looker Studio →
Why a GA4 report sometimes returns sampled or empty charts, and how this template is built to stay inside the quota.
- Schedule the dashboard for email delivery →
How to have Looker Studio send this report by itself, weekly or monthly, with the live data of the moment it goes out.
- Put your client logo and colors on the report →
The three-click white-label pass: duplicate the base report, swap the data source, drop in the client brand.
- Best Looker Studio templates for 2026 →
The full comparison of the six dashboards we build, what each one covers and which situation each one fits.
How it connects
One authorisation of your GA4 property with the native connector inside your own copy of the report. The ecommerce page reads the purchase and item events the property already collects, so the funnel and the revenue match what GA4 itself shows, arranged for a shop owner rather than an analyst.
Setup guides that apply
- Connect GA4, Search Console or Google Ads to your Data Studio template · Connect your Google Analytics 4, Google Search Console or Google Ads data to your copy of the Data Studio template in minutes, with Google’s native connectors and no third-party service.
- No data or access error in a Data Studio report · Why a page of the Data Studio template comes up empty or shows an access error after connecting Google Analytics 4, Search Console or Google Ads, and the fix for each cause.
- Change the currency shown in a Data Studio report · Where the currency symbol in a Data Studio report comes from, and how to switch a whole page or a single chart of the template to your own currency in Google Ads and GA4 fields.
The team agencies hire to build their dashboards
Six dashboards, one team, one design system.
- 4.97 / 5
across 100 verified reviews, 94 of them five stars, from clients in 27 countries who hired us to build their Looker Studio dashboards
Read every review - 85 fields
documented across Google Search Console, Google Analytics 4 and Google Ads, one definition each, so you know what every number in the report means
Open the Google Analytics 4 reference - Lifetime
updates and a setup guide with every dashboard, from the same team that built it
Docs, delivery and setup - 329,000+
reads on our Looker Studio guides, written by the people who build the dashboards
Read the guides
Before you ask
- Does it need enhanced ecommerce events?
- It reads the GA4 ecommerce events Google documents: view_item, add_to_cart, begin_checkout and purchase, with items and revenue. If your property sends them, the funnel fills itself; if it does not, the page shows the gaps to fix.
- Shopify or WooCommerce?
- Either, as long as the store sends GA4 ecommerce events. The report reads the property, not the shop platform, so it works with any store that tags GA4 correctly.
- The funnel shows zeros. Why?
- The funnel reads view_item, add_to_cart, begin_checkout and purchase. If a step is zero, the property is not sending that event; GA4's DebugView shows which one is missing, and the setup guide lists the four to check.
- Can it show revenue in my currency?
- Yes. The report shows the currency of your GA4 property; the doc on changing the report currency covers the two places to set it.
The terms this report uses
- GA4 (Google Analytics 4)
GA4 is the current generation of Google Analytics, built on an event model: every interaction, a page view, a click, a purchase, is an event with parameters.
- Key events
Key events are the events in Google Analytics 4 that you mark as the ones that matter to the business: a purchase, a lead form, a sign-up, a call.
- Event count
Event count is the number of times an event was triggered in Google Analytics 4 during the selected period.
- Landing page
A landing page is the first page a visitor sees in a session, the page that won the visit.
- Default channel group
The default channel group is the set of rules Google Analytics 4 uses to sort traffic into channels such as Organic Search, Paid Search, Direct, Referral, Organic Social, Email and Cross-network, based on the source, medium and campaign of each session.
- Conversion rate
Conversion rate is the percentage of interactions that led to a conversion; in Google Ads it is conversions divided by clicks (interactions), and in Google Analytics 4 the equivalent is the key event rate, sessions with a key event divided by all sessions.
- Sessions
A session is a group of interactions one user has with a website within a period of time; in Google Analytics 4 it starts with a session_start event and ends after 30 minutes of inactivity.
Ecommerce Report, built. Yours the same afternoon.
Copy the template into your own Data Studio, connect your property, put your brand on it. The report your client opens on Monday is the one you saw in the demo today.
$129
One-time payment. No taxes charged.
94 of 100 buyers gave it five stars, from 27 countries. Every review, with its date.