The PPC report that catches drift before the invoice does.
A campaign that stops spending, a CPA that creeps up, a keyword burning budget without converting; all visible in days on a live report, not at month-end.





4.97 from 100 reviews in 27 countries: read them
What a PPC report is
A PPC report in Data Studio (formerly Looker Studio) tells whether paid campaigns are paying for themselves: spend, clicks, conversions, cost per conversion and return on ad spend, per campaign and against the previous period. The number that matters is rarely the total. It is the campaign whose CPA drifted, the keyword that spends without converting, the audience that quietly stopped.
This template reads your Google Ads account through Google's own connector and lays those numbers out for the weekly optimisation pass and the monthly client report on the same link. Campaigns are ranked so the losers cannot hide, every figure carries its delta against last period, and the keyword and audience pages show where the budget actually goes below campaign level.
Who opens it
PPC agencies
One copy per client account. The weekly check and the monthly report are the same link, so nothing is rebuilt for the meeting.
In-house paid media managers
A report the finance team can open: spend against results, per campaign, without a Google Ads login.
Business owners running their own ads
The drift that costs money shows as a number in days, not as a surprise on the invoice.
A PPC report, live: 8 pages on real data
The template itself, embedded from Looker Studio on demo data. Click through it here, or pick a page below. The orange field is where your own property goes once the copy is yours.
The 8 pages of a PPC report, in order.
Each one photographed from the live template, with what it is for and the fields it reads. Every field links to its definition; every page opens in the live report above.
- Page 1 of 8
Overview
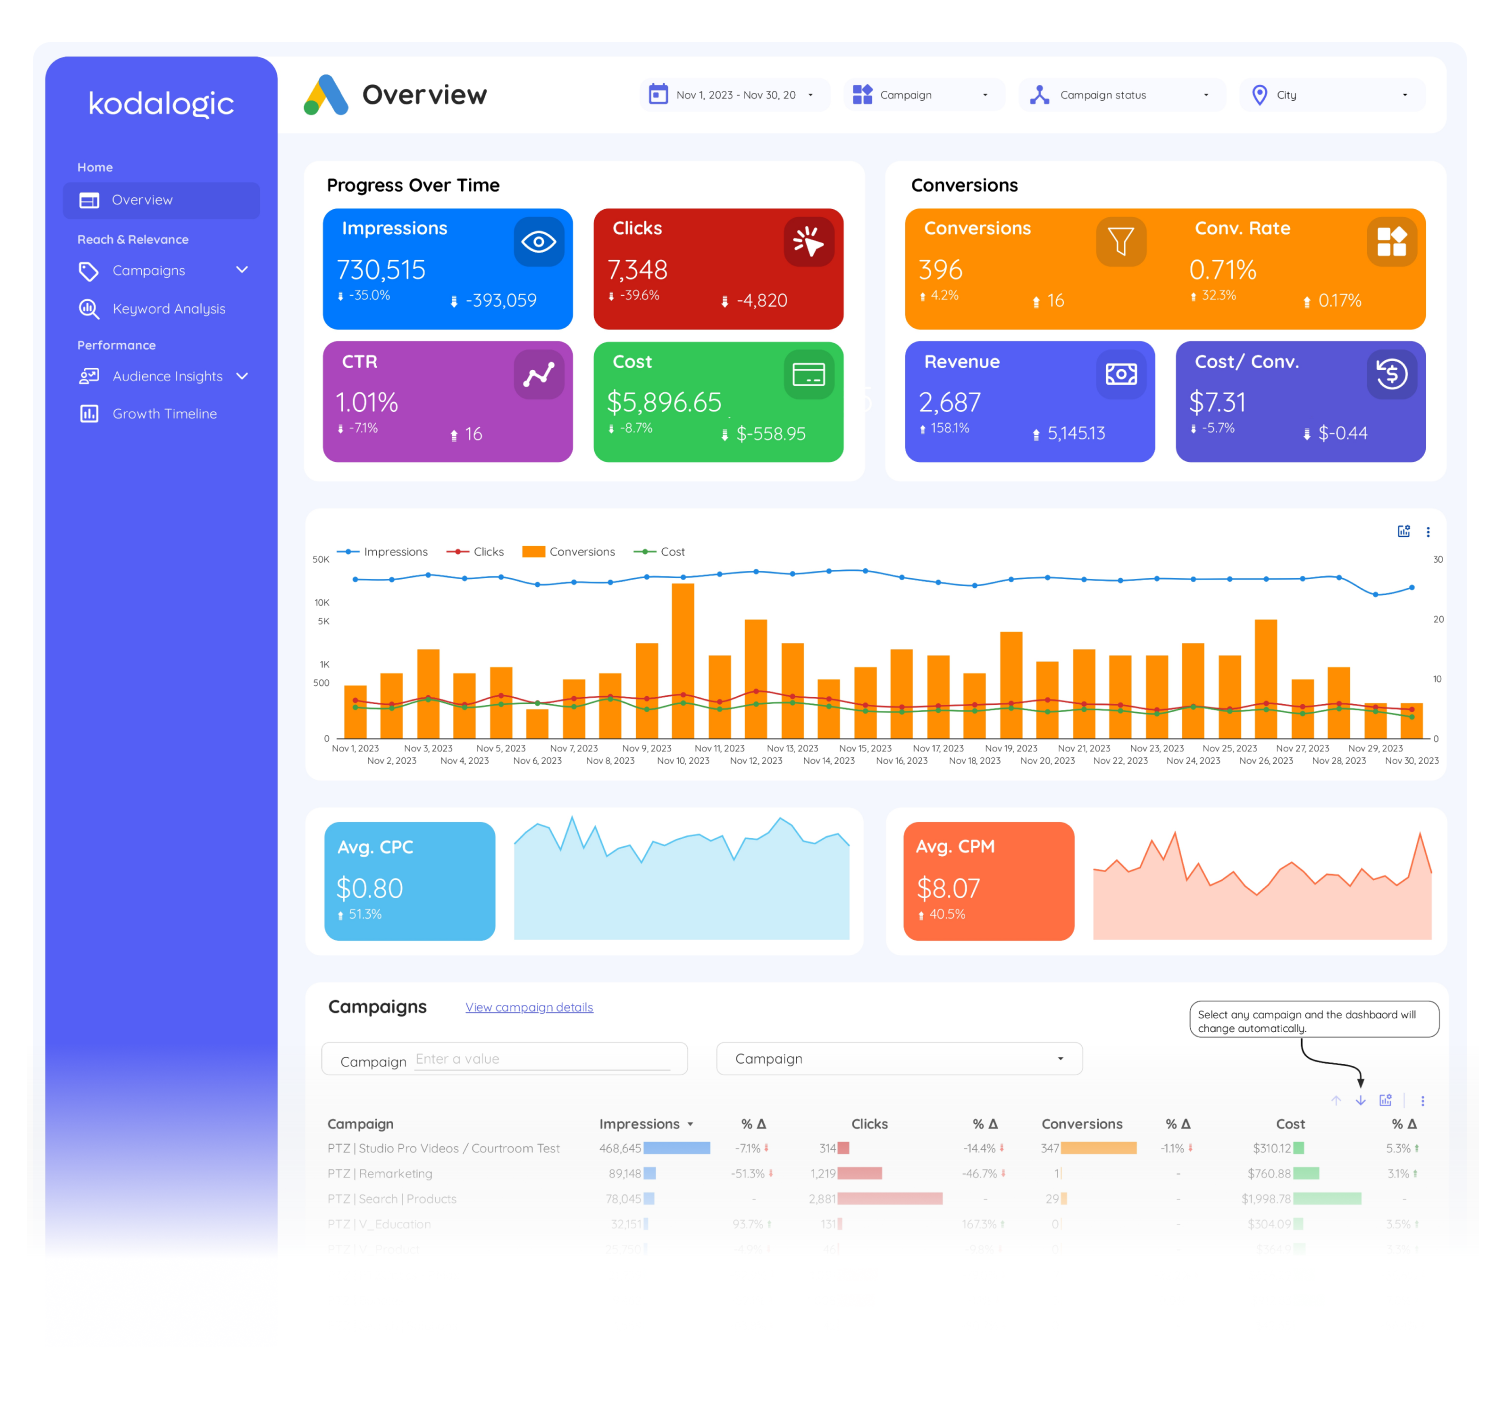
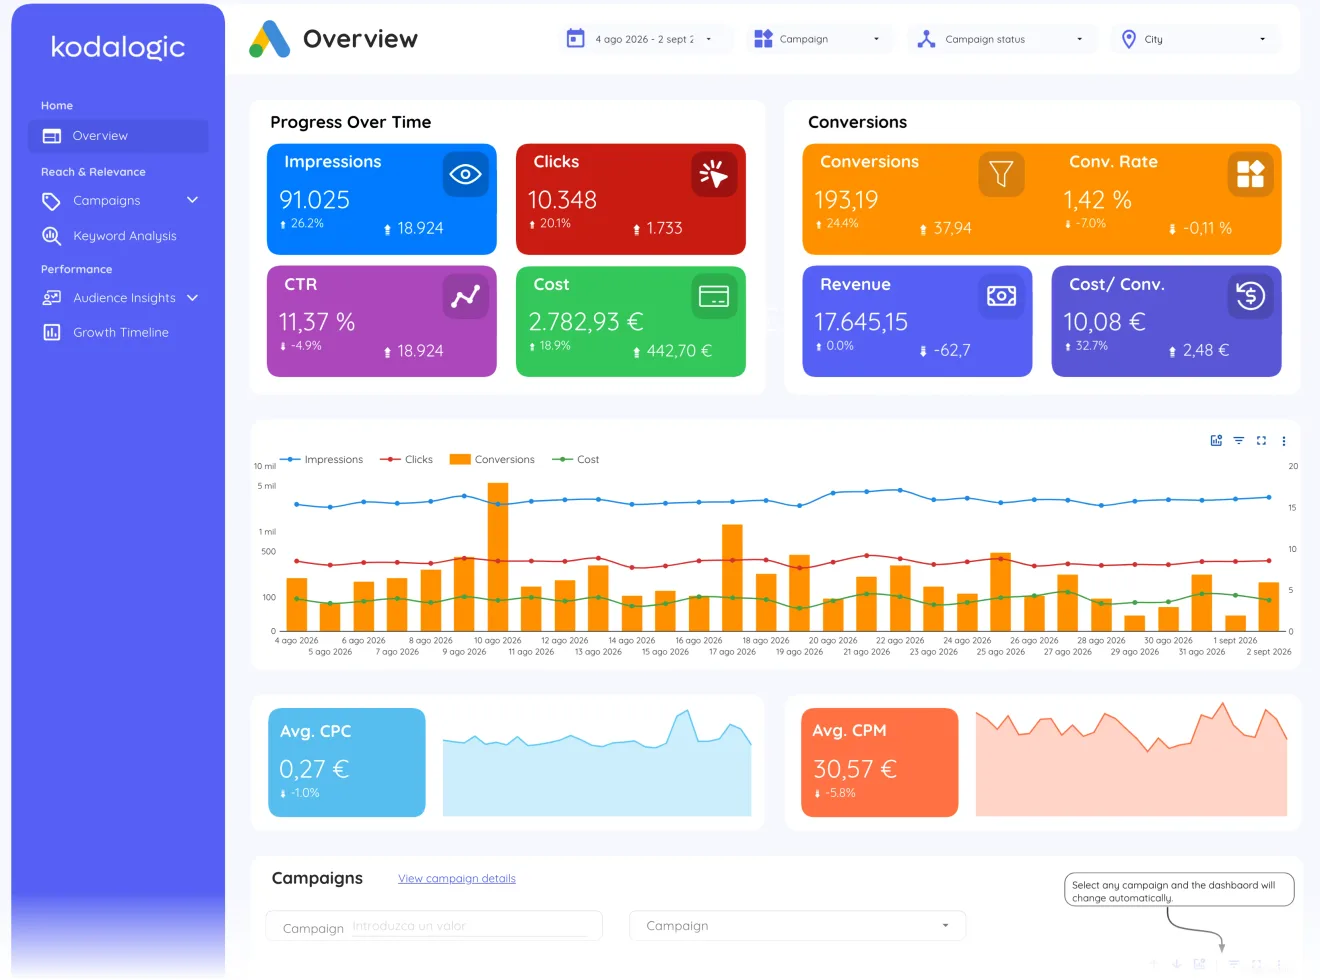
The eight account numbers, impressions, clicks, CTR and cost beside conversions, conversion rate, revenue and cost per conversion, each with its period-over-period change and the CPC and CPM curves underneath. The first thirty seconds of any stakeholder call.
Reads: Impressions · Clicks · Conversions · Conv. Rate · CTR
- Page 2 of 8
Campaigns
Every campaign compared side by side by type, with its share of spend and its share of results. The reallocation conversation, pre-sorted: which line deserves more budget and which one is buying nothing.
Reads: Impressions · Clicks · Conversions · Cost · Total conv. value
- Page 3 of 8
Search campaigns
The Search side isolated: campaign-level impressions, clicks, conversions, cost and revenue with average CPM, CPC and cost per conversion trended, so search efficiency is judged on its own numbers.
Reads: Impressions · Conversions · Clicks · Cost · CTR
- Page 4 of 8
Display campaigns
The same anatomy for Display: reach, clicks and conversions with their costs over time, the page that shows whether awareness budget is producing anything measurable.
Reads: Impressions · Conversions · Clicks · Cost · CTR
- Page 5 of 8
Keyword analysis
Every keyword split by match type (broad, phrase and exact) with its own impressions, conversions, conversion rate and cost, and two charts showing how spend and conversions divide between them. Broad carries the volume; this page says whether it also carries the conversions.
Reads: Impressions · Conversions · Conv. rate · Cost · Clicks
- Page 6 of 8
Audience: location
A geographic map of conversions and cost, from country down to city, with the best and worst markets ranked. Two campaigns with identical budgets rarely perform the same in every region; this page shows the difference.
Reads: Impressions · Conversions · Clicks · Cost · CTR
- Page 7 of 8
Audience: demographic
Age and gender segmentation with conversions per segment. When impressions cluster at 18-24 but conversions come from 35-44, this page is where the bid adjustment gets decided.
Reads: Impressions · Conversions · Clicks · Cost · CTR
- Page 8 of 8
Growth timeline
Total performance over twelve months with the best day, week, month and quarter surfaced automatically: seasonal patterns and momentum, visible without exporting anything.
Reads: Clicks · Impressions · Conversions · Cost · Conv. rate
The sections a PPC report needs, and the questions each one answers
Campaigns side by side
Spend, clicks, conversions, CPA and ROAS per campaign, sorted so the losers are impossible to miss.
- Which campaigns pay for themselves, and which quietly stopped?
Period-over-period deltas
Every campaign compared against its previous period: drift shows as a number, not a feeling.
- Where did CPA drift against last period?
Keyword and audience breakdowns
Where the spend actually goes, below campaign level.
- Which keywords and audiences actually carry the spend?
Always current
Connected straight to Google Ads: the same link serves the weekly optimisation pass and the monthly client report.
- Can the same link serve the weekly check and the monthly report?
The template, in numbers
- Best for...
- For marketing teams maximizing Google Ads.
- Traffic Overview
- Traffic analysis: search, display, video.
- Conversion Tracking
- Tracks ad conversions and CPA.
- Audience Insights
- Audience segmentation by demographics and interests.
- Keyword Performance
- Paid keyword insights: match types, ROI, conversions.
- Search Engine Optimization
- Limited SEO insights; focus on Ads performance.
- Acquisition Channels
- Acquisition insights by ad type and channel.
- Geographic Data
- City-level insights from Google Ads.
- User Engagement Metrics
- Engagement metrics: impressions, clicks, CTR.
- Setup Time
- Setup in under 1 minute.
Which template to buy for a PPC report
Built for this report
Google Ads Dashboard for Data Studio
Live Google Ads reporting without the exports. Track spend, ROAS, and conversions in a dashboard you can share with one link.
$129
One-time payment, lifetime updates, unlimited copiesWhen another one fits better
When the question after 'what did the ads cost' is 'what did those visitors do': it adds GA4 behaviour and conversions to the same report.
When organic search runs alongside paid and the client wants both channels on one link.
- Compare all six side by side
What buyers say about working with kodalogic
- ★★★★★
carrieloranger, United States of AmericaHe was very knowledgeable with Data Studio/Looker and helped me so much. When it was time to make changes, he was very responsive and accommodating. He is a happy and hard-working person and I can tell that he enjoys his work and helping his clients very much. I would say he went above and beyond in terms of being responsive and accommodating to all of the requested edits. I will definitely use him again and highly recommend him to anyone who needs expertise with reporting dashboards.
- ★★★★★
atd144, NetherlandsI am extremely satisfied with the service I received. The work performed was exceptionally professional and the freelancer proved to be highly committed and willing to meet all of our needs. Communication was fluid and effective at all times, which made the process even more pleasant. I would definitely recommend Kodalogic for this type of work and look forward to working with him again in the future.
- ★★★★★
heymindbyte, GermanyI recently worked with Kodalogic on a Google Looker Studio Dashboard, and the experience was fantastic. He designed an impressive dashboard and skillfully fixed errors in an older one. His communication was clear, and his expertise was evident throughout the project. I'm absolutely satisfied with his work and will definitely be collaborating with him again. Highly recommended!
All 100 reviews, with the country and date of each one.
Read the deep dive
- Track ROAS and conversions without the spreadsheet →
Which PPC metrics belong on a dashboard and which ones are vanity, with the ROAS and CPA benchmarks by industry to judge yours against.
- The PPC report that runs itself →
The dashboard structure behind this template: four headline numbers, the spend-versus-conversions trend, the campaign table and one priority flag.
- A PPC dashboard, page by page →
What each page of this report answers, from campaign comparison to match types and audience segments.
- Automated Google Ads reports →
The agency side: white-label reporting, multi-account setups and what automating the monthly cycle actually returns in hours.
- Schedule the dashboard for email delivery →
How to have Looker Studio send this report by itself, weekly or monthly, with the live data of the moment it goes out.
- Put your client logo and colors on the report →
The three-click white-label pass: duplicate the base report, swap the data source, drop in the client brand.
- Best Looker Studio templates for 2026 →
The full comparison of the six dashboards we build, what each one covers and which situation each one fits.
How it connects
The report connects to your Google Ads account through Google's native connector; your credentials, your data, nothing passing through us. Agencies typically keep one copy per client; each copy is an ordinary Data Studio report whose colors, logo and pages are fully editable after purchase.
Setup guides that apply
- Connect GA4, Search Console or Google Ads to your Data Studio template · Connect your Google Analytics 4, Google Search Console or Google Ads data to your copy of the Data Studio template in minutes, with Google’s native connectors and no third-party service.
- Change the currency shown in a Data Studio report · Where the currency symbol in a Data Studio report comes from, and how to switch a whole page or a single chart of the template to your own currency in Google Ads and GA4 fields.
- Share a Data Studio report with clients and schedule email delivery · Share your Data Studio report template with clients through a live viewer link, or schedule a PDF snapshot by email every week or month; both are built into Data Studio.
The team agencies hire to build their dashboards
Six dashboards, one team, one design system.
- 4.97 / 5
across 100 verified reviews, 94 of them five stars, from clients in 27 countries who hired us to build their Looker Studio dashboards
Read every review - 85 fields
documented across Google Search Console, Google Analytics 4 and Google Ads, one definition each, so you know what every number in the report means
Open the Google Ads reference - Lifetime
updates and a setup guide with every dashboard, from the same team that built it
Docs, delivery and setup - 329,000+
reads on our Looker Studio guides, written by the people who build the dashboards
Read the guides
Before you ask
- Does it handle multiple accounts?
- The template connects to the Google Ads account you choose; agencies typically make one copy per client.
- Does ROAS come built in?
- Yes: revenue and spend are read from Google Ads, and ROAS is computed per campaign in the report.
- Which currency does it show?
- The currency of the Google Ads account it reads. If you want another symbol or a conversion, the setup guide covers both; Data Studio labels amounts but does not convert them.
- Does it include conversion value and ROAS from my own conversion actions?
- Yes. Conversions and conversion value come from the conversion actions configured in your Google Ads account, and ROAS is computed in the report from value and cost.
- Can I show only some campaigns to a client?
- Yes. A filter on the campaign name, saved with the report, limits every page to those campaigns. Agencies use one filtered copy per client when several share an account.
The terms this report uses
- PPC dashboard
A PPC dashboard is a live report of paid-campaign performance, spend, clicks, conversions, CPA and ROAS, pulled automatically from ad platforms like Google Ads, so the numbers are current every time the report is opened.
- ROAS (return on ad spend)
ROAS is revenue attributed to advertising divided by the cost of that advertising.
- Cost per conversion
Cost per conversion is the total advertising spend divided by the number of conversions it produced: what one result cost.
- Average CPC
Average CPC (cost per click) is the total cost of clicks divided by the number of clicks: the average price paid for one visit from an ad.
- Conversion rate
Conversion rate is the percentage of interactions that led to a conversion; in Google Ads it is conversions divided by clicks (interactions), and in Google Analytics 4 the equivalent is the key event rate, sessions with a key event divided by all sessions.
- Campaign name
Campaign name is the label given to an advertising campaign, used as a dimension to group spend, clicks and conversions in Google Ads and, through the utm_campaign tag, to attribute sessions to that campaign in Google Analytics 4.
- Match type
Match type is the setting on a Google Ads keyword that controls how closely a search has to match it for the ad to enter the auction: broad match allows related searches, phrase match requires the meaning of the phrase, and exact match requires the same meaning as the keyword.
PPC Report, built. Yours the same afternoon.
Copy the template into your own Data Studio, connect your property, put your brand on it. The report your client opens on Monday is the one you saw in the demo today.
$129
One-time payment. No taxes charged.
94 of 100 buyers gave it five stars, from 27 countries. Every review, with its date.