One client, one link, every channel.
Organic in one tool, paid in another, behaviour in a third: the all-in-one report exists so a client meeting needs one tab, not five.





4.97 from 100 reviews in 27 countries: read them
What a marketing report is
A marketing report in Data Studio (formerly Looker Studio) brings every channel a business pays attention to onto one page: organic search, paid search and what the website did with the visits. The data lives in three Google tools, Search Console, Google Ads and Google Analytics 4, and the monthly report usually means exporting from each and pasting the results into a deck.
This all-in-one template reads the three sources with Google's own connectors and lays them out on one Data Studio report: a web section from GA4, a search section from Search Console, an ads section from Google Ads, and channel pages where organic and paid sit on the same axes. One link per client answers the whole meeting, and Smart Interpretations writes the cross-channel findings inside.
Who opens it
Marketing agencies
One link per client that covers organic, paid and on-site results, so the monthly meeting needs one tab.
Marketing directors
Budget conversations that start from the same page: what organic delivered, what paid cost, what converted.
Businesses with an agency and in-house staff
A shared report that both sides read, with the numbers coming straight from the accounts.
A marketing report, live: 35 pages on real data
The template itself, embedded from Looker Studio on demo data. Click through it here, or pick a page below. The orange field is where your own property goes once the copy is yours.
35 pages. These 12 do the work of a marketing report.
Each one photographed from the live template, with what it is for and the fields it reads. Every field links to its definition; every page opens in the live report above.
- Page 1 of 35
Web overview
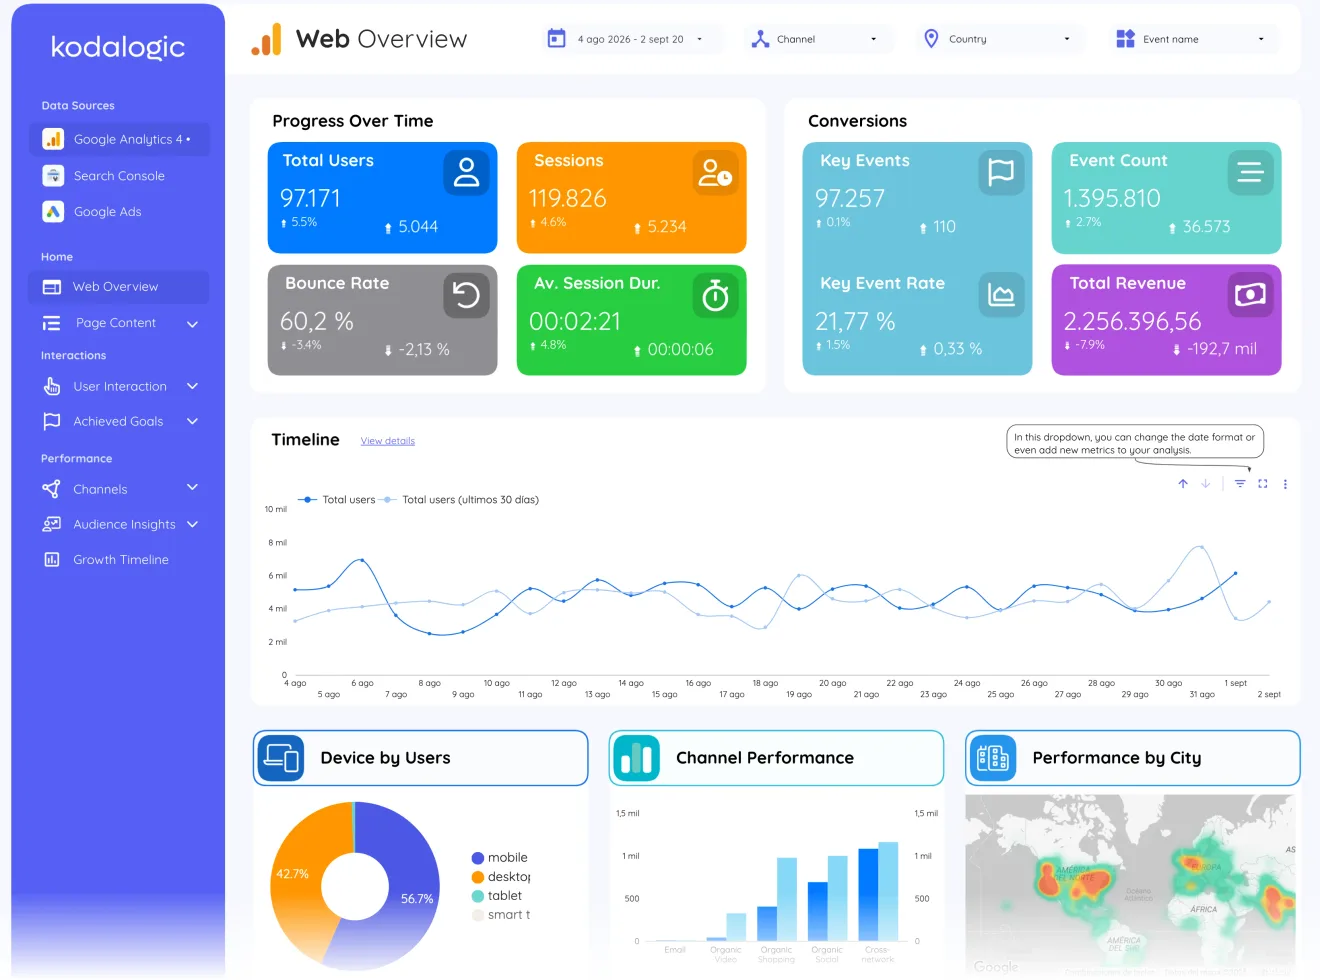
The web module opens the report with its headline numbers and their deltas, split by device, channel and city. The page a client reads first and, often, the only one they read closely.
Reads: Total Users · Sessions · Bounce Rate · Av. Session Dur. · Key Events
- Page 2 of 35
Page content
Every page ranked by views, sessions, bounce and key events with page-path search: which content earns its place across all three channels.
Reads: Page Views · Pages / Session · Pages / User · Avg. Session Dur. · Views
- Page 3 of 35
Landing page
Sessions by landing page over time with the top destinations ranked, the page that shows where organic and paid traffic actually arrives.
Reads: Sessions · Views · Bounce rate · Key events · Landing page
- Page 7 of 35
Conversions
Key events, key event rate and revenue trended and split by device, channel and city: the shared outcome every module in this report is measured against.
Reads: Key Events · Event Count · Key Event Rate · Total Revenue · Event name
- Page 9 of 35
Channels
Organic, paid, direct, referral and social in one table with users, key events and revenue per channel: the single view where the three modules meet and budget decisions get made.
Reads: Total users · Sessions · Bounce rate · Key events · Session key event rate
- Page 14 of 35
Growth timeline
Twelve months of traffic with the best day, week, month and quarter picked out automatically, the long view for renewal conversations.
Reads: Sessions · Total users · Key Events · Bounce rate · Views
- Page 15 of 35
Search overview
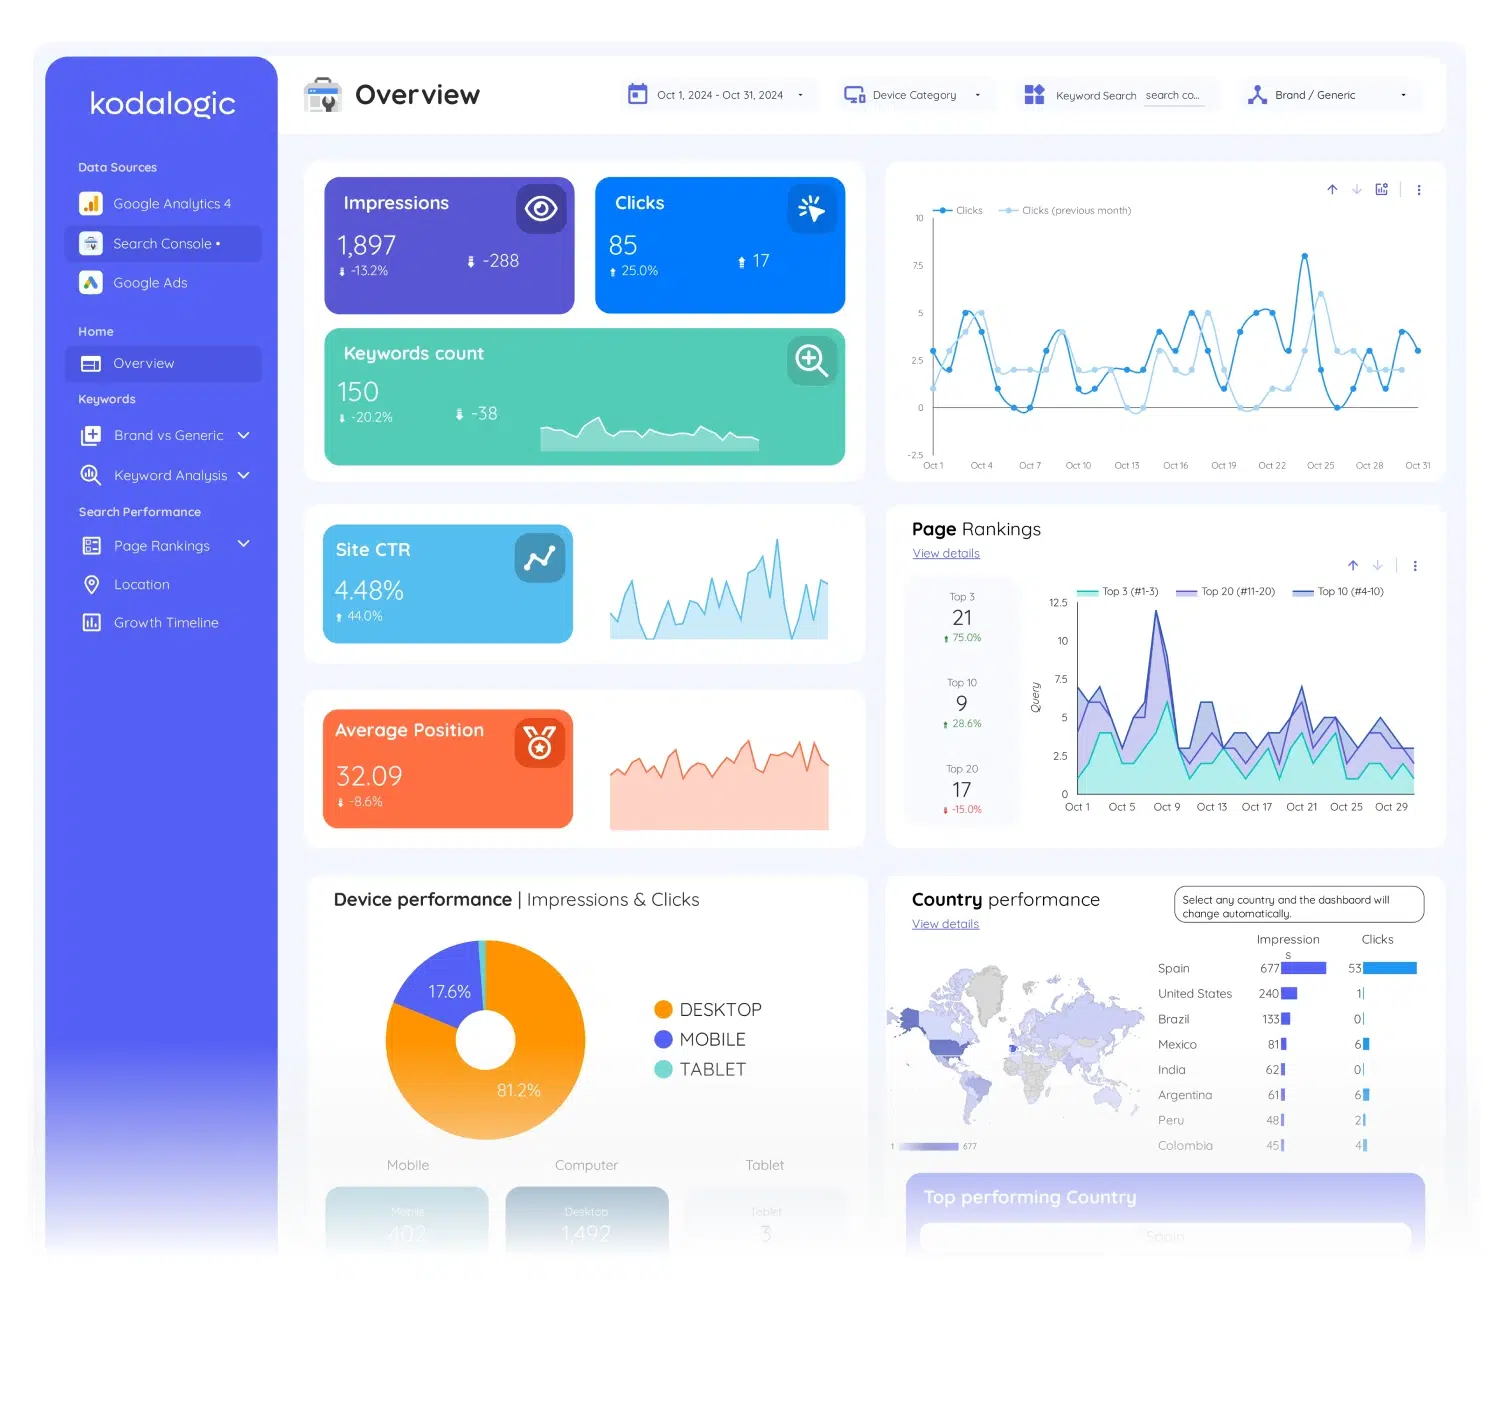
The search module in one screen: visibility, clicks and where the site sits on average, with the device and country cuts. What Google shows, next to what the web module says people did about it.
Reads: Impressions · Clicks · Keywords count · Site CTR · Average Position
- Page 16 of 35
Brand vs generic
The two halves of organic demand measured apart, with a written reading of the divergence underneath. Growth from people who already knew you is a different business story from growth among people who did not.
Reads: Impressions · Clicks · Site CTR · Average Position · Brand Keywords
- Page 22 of 35
Page rankings
Keywords bucketed into top 3, 4 to 10, 11 to 20 and beyond with improved and declined lists: ranking movement caught before it becomes a traffic problem.
Reads: Top 3 · Top 10 · Top 20 · Rest · Average Position Last Quarter
- Page 28 of 35
Ads overview
The ads module and its money questions: what was spent, what came back and what each result cost, with the price curves beneath. In this report it shares a date range with the other two, so paid and organic are finally comparable.
Reads: Impressions · Clicks · Conversions · Conv. Rate · CTR
- Page 29 of 35
Campaigns
Line by line, what each campaign consumed and produced, ranked. Read against the search module, it answers the awkward one: are we paying for terms we already own organically?
Reads: Impressions · Clicks · Conversions · Cost · Total conv. value
- Page 35 of 35
Ads growth timeline
Twelve months of the Ads account, closing the report with the paid momentum view that mirrors the traffic and search timelines.
Reads: Clicks · Impressions · Conversions · Cost · Conv. rate
The sections a marketing report needs, and the questions each one answers
Three sources, one report
GA4, Search Console and Google Ads connected natively and read side by side.
- What did each source contribute to conversions?
Channel vs channel
Organic and paid performance on the same axes, so budget conversations start from data.
- How do organic and paid compare on the same axes this month?
Client-ready by default
One shared link per client that is always current; scheduled email snapshots on top.
- Can one link answer the whole client meeting?
Written analysis
Smart Interpretations writes the cross-channel findings inside the report.
- What changed across channels, in sentences?
The template, in numbers
- Best for...
- Advanced marketers managing multi-channel campaigns.
- Traffic Overview
- Combines GA4 + Search Console + paid traffic data.
- Conversion Tracking
- Multi-channel conversion tracking (GA4, GSC, Ads).
- Audience Insights
- Comprehensive audience insights across organic and paid channels.
- Keyword Performance
- Integrated insights on organic and paid keyword performance.
- Search Engine Optimization
- Comprehensive SEO analysis with Smart Interpretations.
- Acquisition Channels
- Detailed analysis of organic and paid channels (search, display, video).
- Geographic Data
- Geographic performance insights across organic and paid campaigns.
- User Engagement Metrics
- Comprehensive engagement metrics across organic and paid channels.
- Setup Time
- Slightly longer (3-5 min).
Which template to buy for a marketing report
Built for this report
All-in-One Marketing Dashboard for Data Studio
GA4, Search Console, and Google Ads in one live Data Studio dashboard. Stop switching platforms. Start deciding.
$289
One-time payment, lifetime updates, unlimited copiesWhen another one fits better
When there is no organic programme to report and the question is paid campaigns plus site behaviour.
When there are no paid campaigns and the report should go deeper into search and behaviour.
- Compare all six side by side
What buyers say about working with kodalogic
- ★★★★★
carrieloranger, United States of AmericaHe was very knowledgeable with Data Studio/Looker and helped me so much. When it was time to make changes, he was very responsive and accommodating. He is a happy and hard-working person and I can tell that he enjoys his work and helping his clients very much. I would say he went above and beyond in terms of being responsive and accommodating to all of the requested edits. I will definitely use him again and highly recommend him to anyone who needs expertise with reporting dashboards.
- ★★★★★
heymindbyte, GermanyI recently worked with Kodalogic on a Google Looker Studio Dashboard, and the experience was fantastic. He designed an impressive dashboard and skillfully fixed errors in an older one. His communication was clear, and his expertise was evident throughout the project. I'm absolutely satisfied with his work and will definitely be collaborating with him again. Highly recommended!
- ★★★★★
aamirmursleen, PakistanI had a great experience with him. He helped me make a report using Google Looker Studio, with data from Facebook Ads and Google Ads. He knew a lot about these and made a really good report. I asked for many changes, and he did all of them without any problems. He was very patient and made sure I was happy with everything. I'm 100% satisfied with his work. He's the best!
All 100 reviews, with the country and date of each one.
Read the deep dive
- Agency reporting made easy →
The multi-client workflow this report was designed for: one base dashboard, duplicated and rebranded per client in seconds, delivered on a schedule.
- What is an SEO reporting dashboard? →
The client-facing framework behind the search module, and the branded versus non-branded conversation it forces into the open.
- What is Smart Interpretations? →
The analysis layer that runs across all three modules and surfaces the connections between them automatically.
- Track ROAS and conversions without the spreadsheet →
The ads module in depth: which paid metrics belong in a client report and the benchmarks to read them against.
- Automated SEO reports with a Data Studio dashboard →
What the whole cycle costs an agency by hand, and what changes when the report assembles and sends itself.
- Schedule the dashboard for email delivery →
How to have Looker Studio send this report by itself, weekly or monthly, with the live data of the moment it goes out.
- Put your client logo and colors on the report →
The three-click white-label pass: duplicate the base report, swap the data source, drop in the client brand.
- Best Looker Studio templates for 2026 →
The full comparison of the six dashboards we build, what each one covers and which situation each one fits.
How it connects
The three connectors, GA4, Search Console and Google Ads, are Google's own and free; you authorise each once in your copy. That is the whole setup: no data pipeline, no third-party storage, and the one link per client stays current for as long as the accounts stay connected.
Setup guides that apply
- Connect GA4, Search Console or Google Ads to your Data Studio template · Connect your Google Analytics 4, Google Search Console or Google Ads data to your copy of the Data Studio template in minutes, with Google’s native connectors and no third-party service.
- Share Data Studio report access with another email · How to give a client or colleague viewer access to your Data Studio report template from another Google account, and what to do when they still cannot see the data.
- Share a Data Studio report with clients and schedule email delivery · Share your Data Studio report template with clients through a live viewer link, or schedule a PDF snapshot by email every week or month; both are built into Data Studio.
- Which Data Studio template do I need? · Choose the right Data Studio report template by the report you deliver: Google Analytics 4, Google Search Console or Google Ads for one channel, the all-in-one dashboard for the whole picture.
The team agencies hire to build their dashboards
Six dashboards, one team, one design system.
- 4.97 / 5
across 100 verified reviews, 94 of them five stars, from clients in 27 countries who hired us to build their Looker Studio dashboards
Read every review - 85 fields
documented across Google Search Console, Google Analytics 4 and Google Ads, one definition each, so you know what every number in the report means
Open the Google Analytics 4 reference - Lifetime
updates and a setup guide with every dashboard, from the same team that built it
Docs, delivery and setup - 329,000+
reads on our Looker Studio guides, written by the people who build the dashboards
Read the guides
Before you ask
- Do I need all three sources connected?
- The report is built for the three; each connects with its native connector to your own accounts.
- Is this the most complete template?
- It is the widest one in the catalog: the single-source templates go deeper into their one channel.
- Do the three sources have to belong to the same Google account?
- No. Each data source is authorised separately inside your copy, so the GA4 property, the Search Console property and the Google Ads account can live in different accounts.
- Is it heavier or slower than the single-source templates?
- It has more pages, thirty-five, but each page queries only its own source, so it opens as fast as the others. Data Studio caches every source, and the setup guide explains the refresh setting.
- Can I hide the ads section for a client without paid campaigns?
- Yes. Hide the pages in your copy, or make a copy without them. Every copy is a normal Data Studio report and pages can be hidden from the navigation in one click.
The terms this report uses
- Default channel group
The default channel group is the set of rules Google Analytics 4 uses to sort traffic into channels such as Organic Search, Paid Search, Direct, Referral, Organic Social, Email and Cross-network, based on the source, medium and campaign of each session.
- ROAS (return on ad spend)
ROAS is revenue attributed to advertising divided by the cost of that advertising.
- Key events
Key events are the events in Google Analytics 4 that you mark as the ones that matter to the business: a purchase, a lead form, a sign-up, a call.
- Impressions
An impression is counted each time a link to a site appears in a search results page a user views, whether or not it is clicked.
- Sessions
A session is a group of interactions one user has with a website within a period of time; in Google Analytics 4 it starts with a session_start event and ends after 30 minutes of inactivity.
- Automated reporting
Automated reporting is the practice of connecting a report directly to its data sources so it fills and refreshes itself, replacing the manual cycle of exporting data, pasting it into slides and rebuilding charts each period.
- Smart Interpretations
Smart Interpretations is the feature in Kodalogic’s Data Studio (formerly Looker Studio) templates that reads the connected data and writes the analysis as plain-language text inside the report, what changed, where, and what it suggests, instead of leaving the reader alone with the charts.
Marketing Report, built. Yours the same afternoon.
Copy the template into your own Data Studio, connect your property, put your brand on it. The report your client opens on Monday is the one you saw in the demo today.
$289
One-time payment. No taxes charged.
94 of 100 buyers gave it five stars, from 27 countries. Every review, with its date.