Try the live demo of every Data Studio template
Every template page opens the actual report inside Data Studio’s (formerly Looker Studio) viewer, populated with live data: the same report you would copy, not a screenshot.
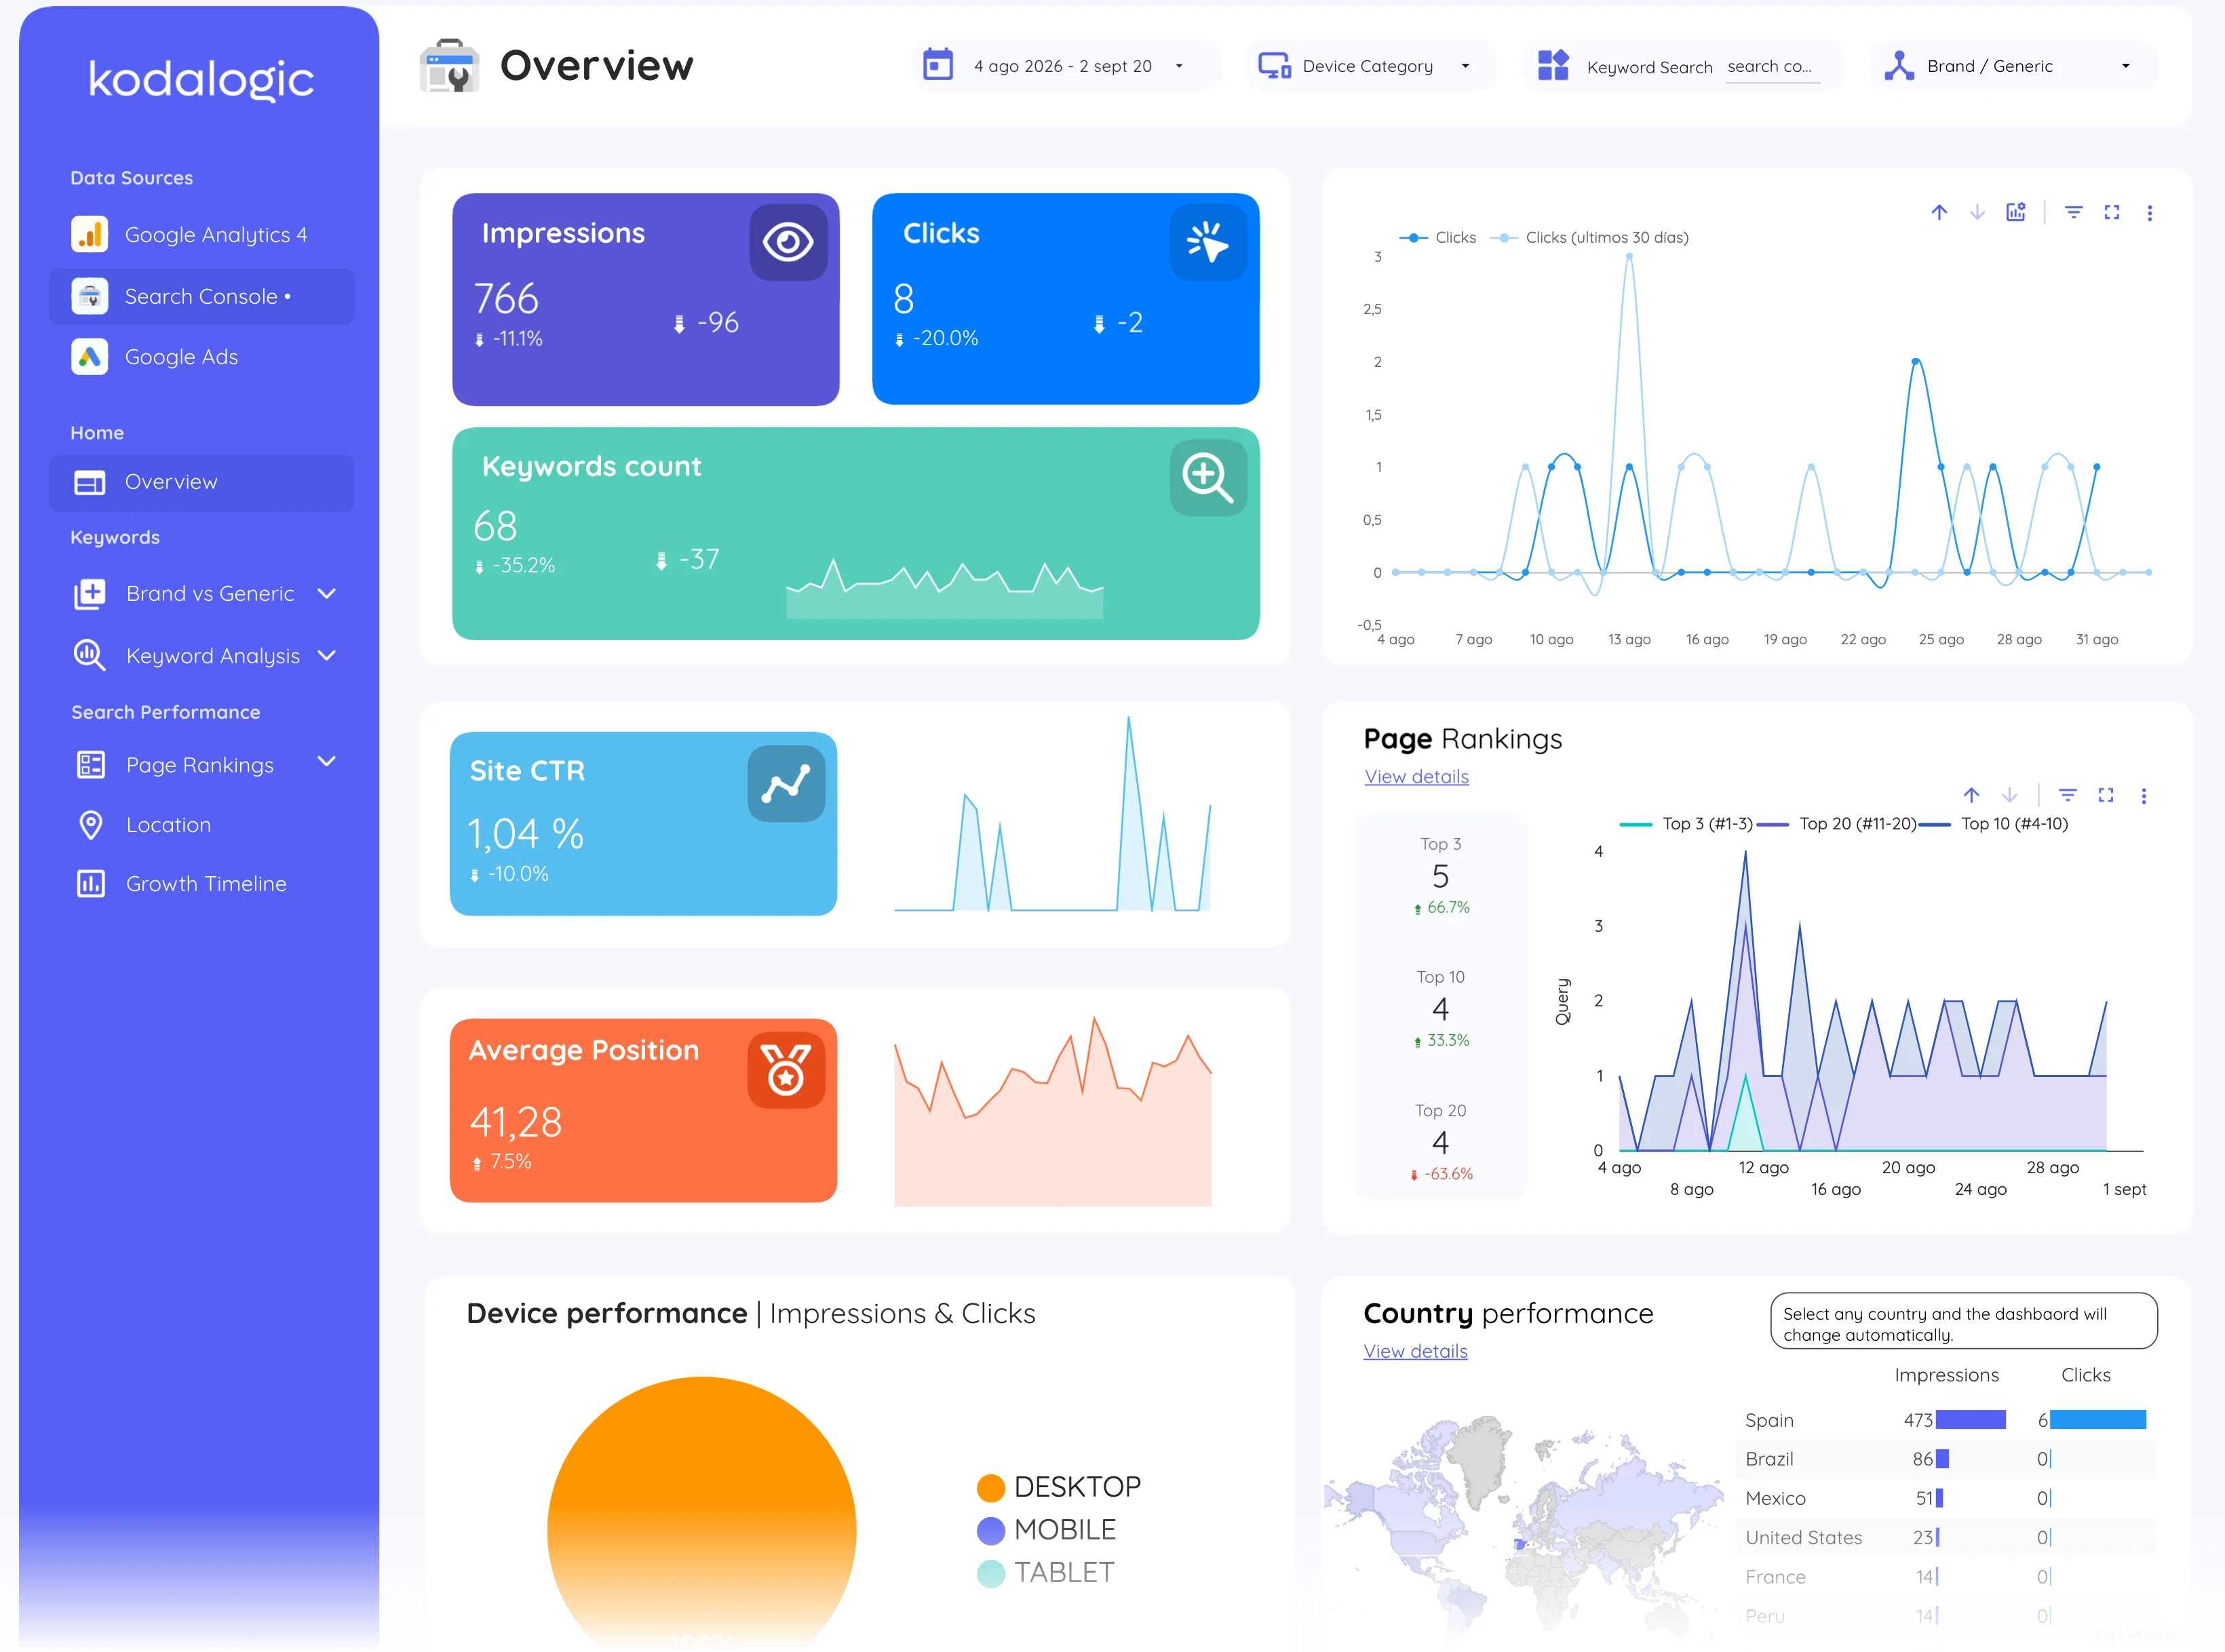
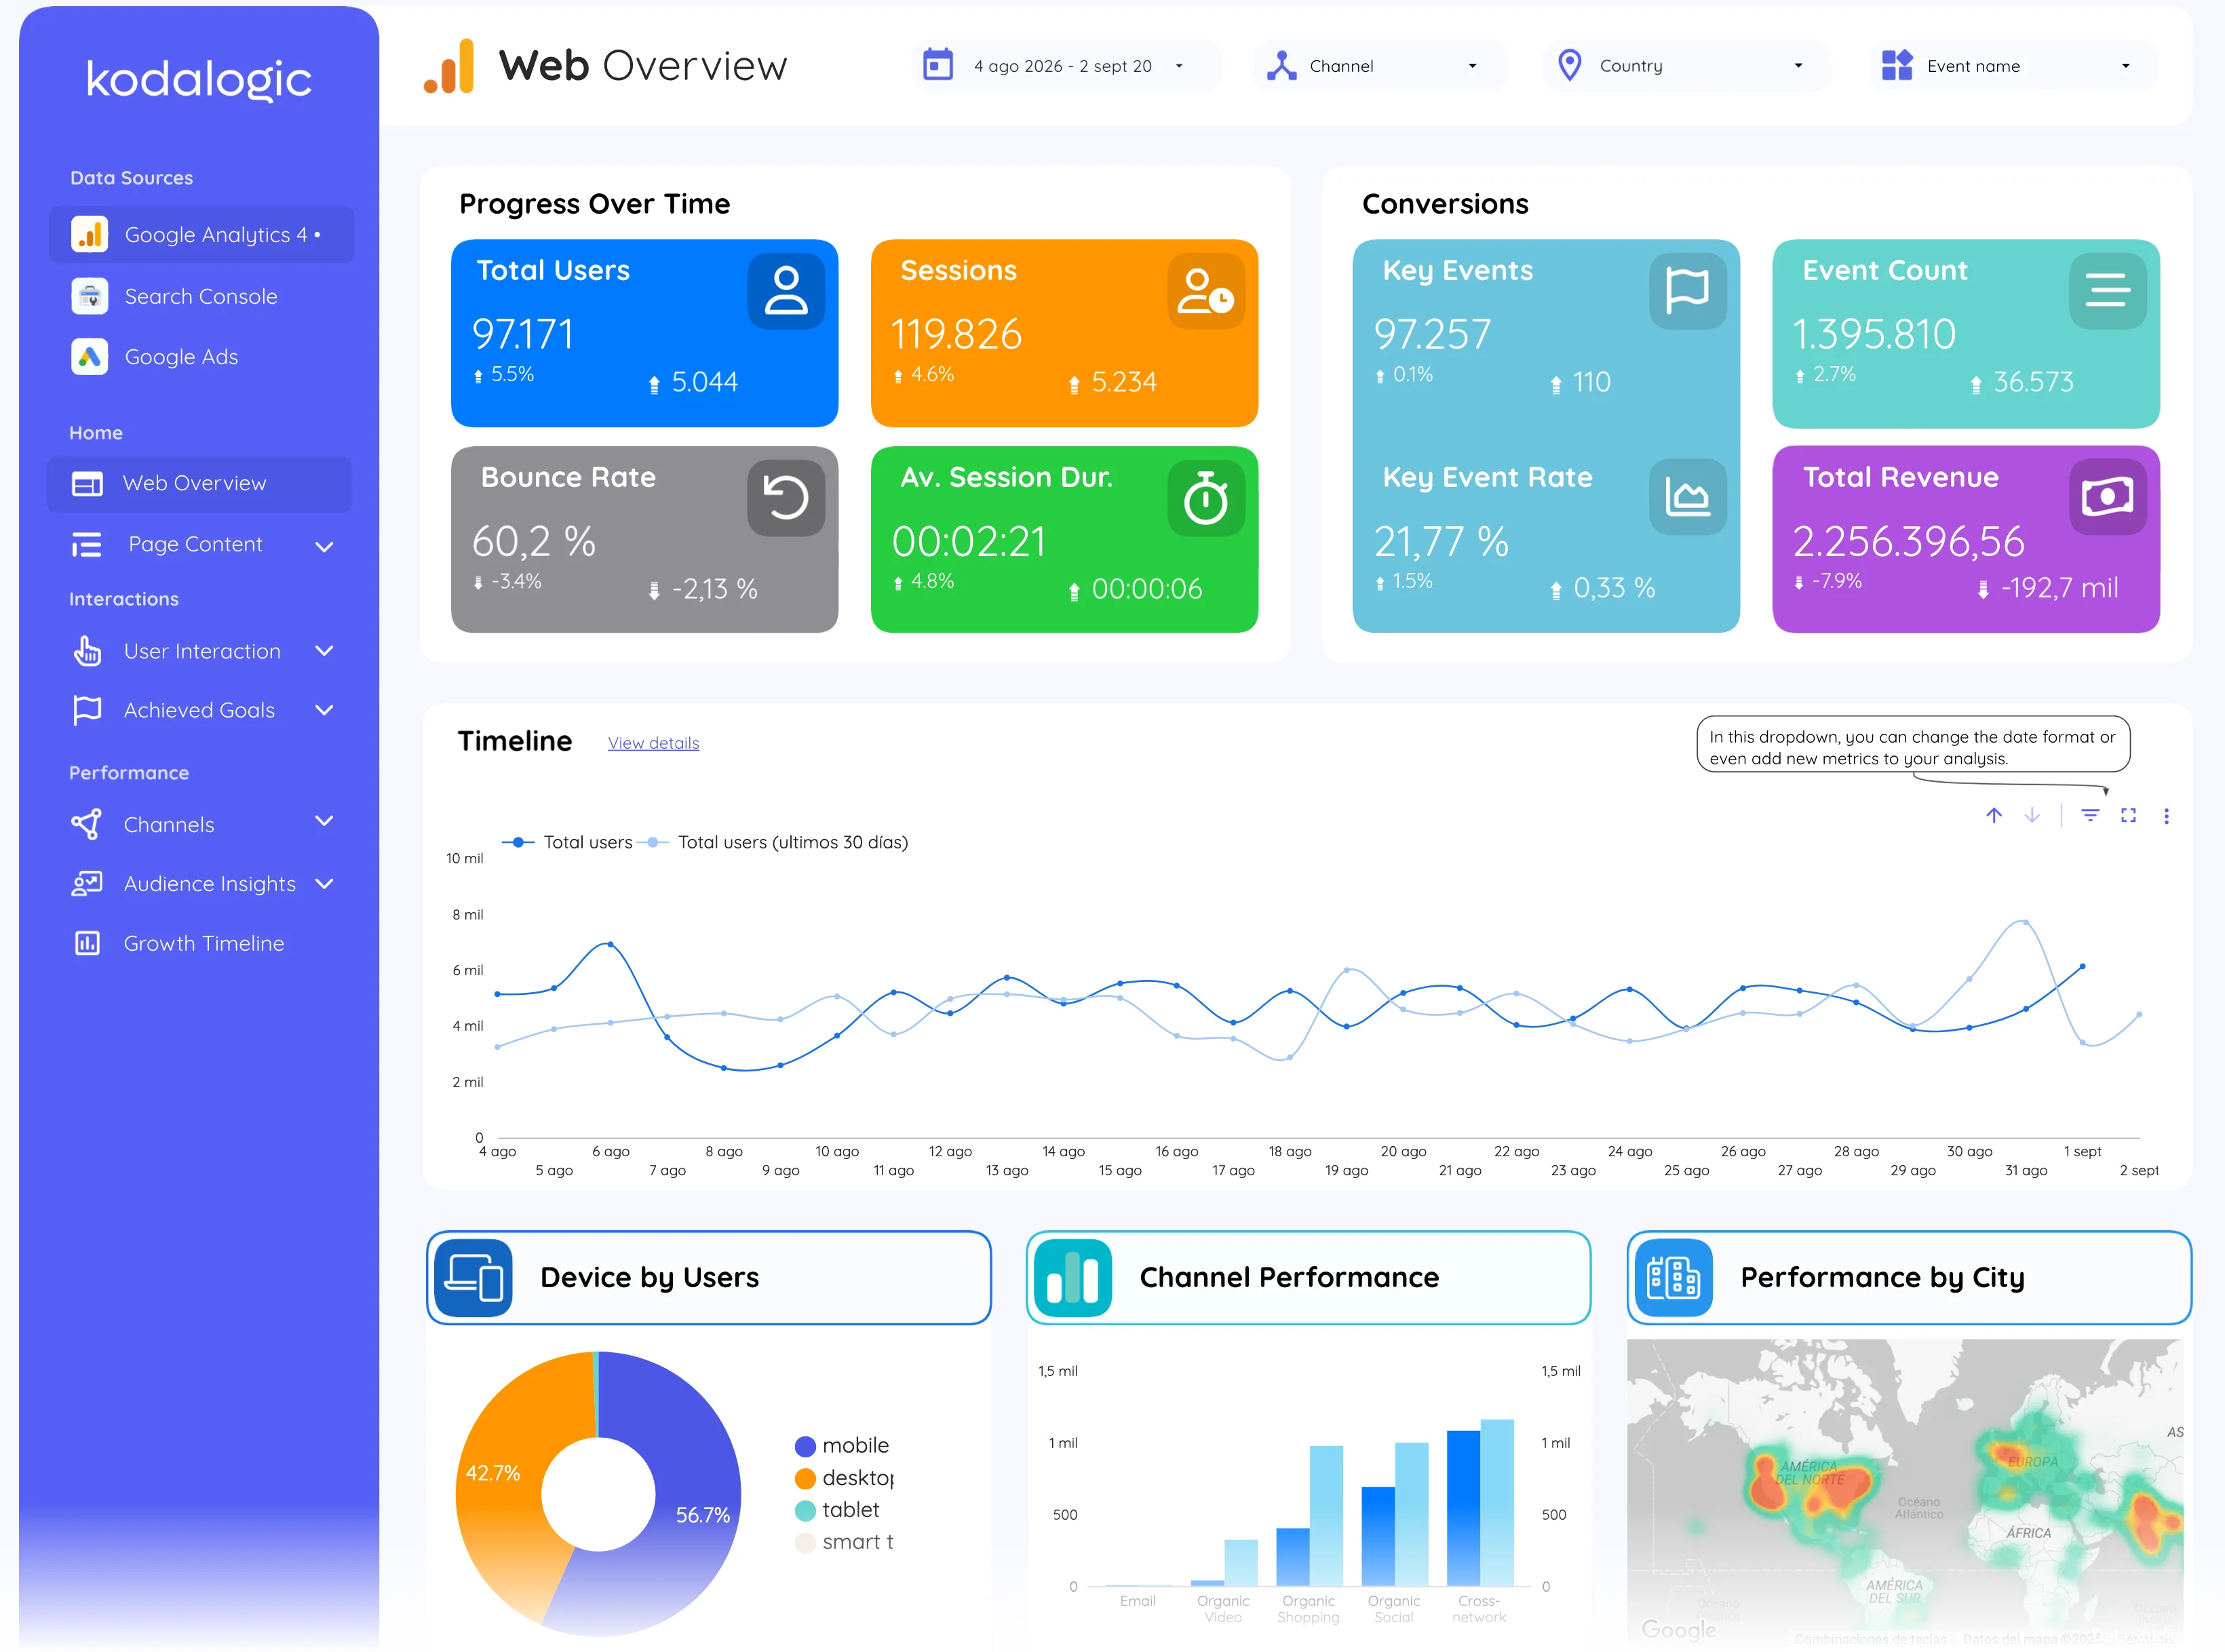
What the demo is
The demo is the report itself, embedded in view mode and connected to a real Google account. Every page, filter, date picker and drill-down works exactly as it will in your copy. The only difference is that you cannot edit it and that the numbers are ours, not yours.
Because it runs on a live account, the figures move between visits. That is deliberate: a report that only ever showed one good month would tell you nothing about how it behaves with real, uneven data.
Four things to check before paying
- 01
Open the page list. Count the pages against the report you have to deliver and make sure every question your reader asks has a page.
- 02
Change the date range at the top to a long period, three or six months. A chart designed only for the last thirty days shows it immediately.
- 03
Use the filters (channel, country, device, campaign). The report is built for them to change every chart on the page at once.
- 04
Open it on the screen your client will use. Data Studio does not reflow a page; what you see on a laptop is what they will see, and a page that reads well at 1440 px can crowd at 1280.
What the demo cannot show you
It cannot show your own data. Fields that your property does not collect, a custom event, an e-commerce revenue stream you do not have, will simply stay empty in your copy: nothing breaks, the chart waits for the data. The doc on empty pages explains how to swap a field you do not use.
Check
You clicked through every page, not only the first.
You changed the date range and the report still read well.
You know which of its pages you will hide for your client.