The monthly SEO report, assembled by itself.
Agencies spend hours each month pasting Search Console screenshots next to GA4 exports. A live report reads both sources and is done before you open it.





4.97 from 100 reviews in 27 countries: read them
What an SEO report is
An SEO report in Data Studio (formerly Looker Studio) is the periodic summary of a site's organic search performance: how visible it was, which queries and pages earned that visibility, and what the visits did once they arrived. The first half lives in Google Search Console; the second in Google Analytics 4. Most monthly SEO reports are assembled by hand from both, which is where the hours go.
This template joins the two sources on one Data Studio report. The search pages read Search Console: impressions, clicks, CTR, average position, brand against generic. The web pages read GA4: sessions, engagement, key events, landing pages. Both refresh themselves, and Smart Interpretations writes what changed in sentences, so the monthly SEO report exists before anyone opens it.
Who opens it
Agencies reporting to clients monthly
The assembly step disappears: one link per client, current every morning, with a scheduled PDF for the clients who want email.
Marketing managers
Search and site data on the same page, so the question 'did SEO bring business' has one answer instead of two exports.
SEO specialists
A daily view of rankings and their traffic that doubles as the monthly deliverable, with no rebuild.
An SEO report, live: 27 pages on real data
The template itself, embedded from Looker Studio on demo data. Click through it here, or pick a page below. The orange field is where your own property goes once the copy is yours.
27 pages. These 12 do the work of an SEO report.
Each one photographed from the live template, with what it is for and the fields it reads. Every field links to its definition; every page opens in the live report above.
- Page 1 of 27
Web overview
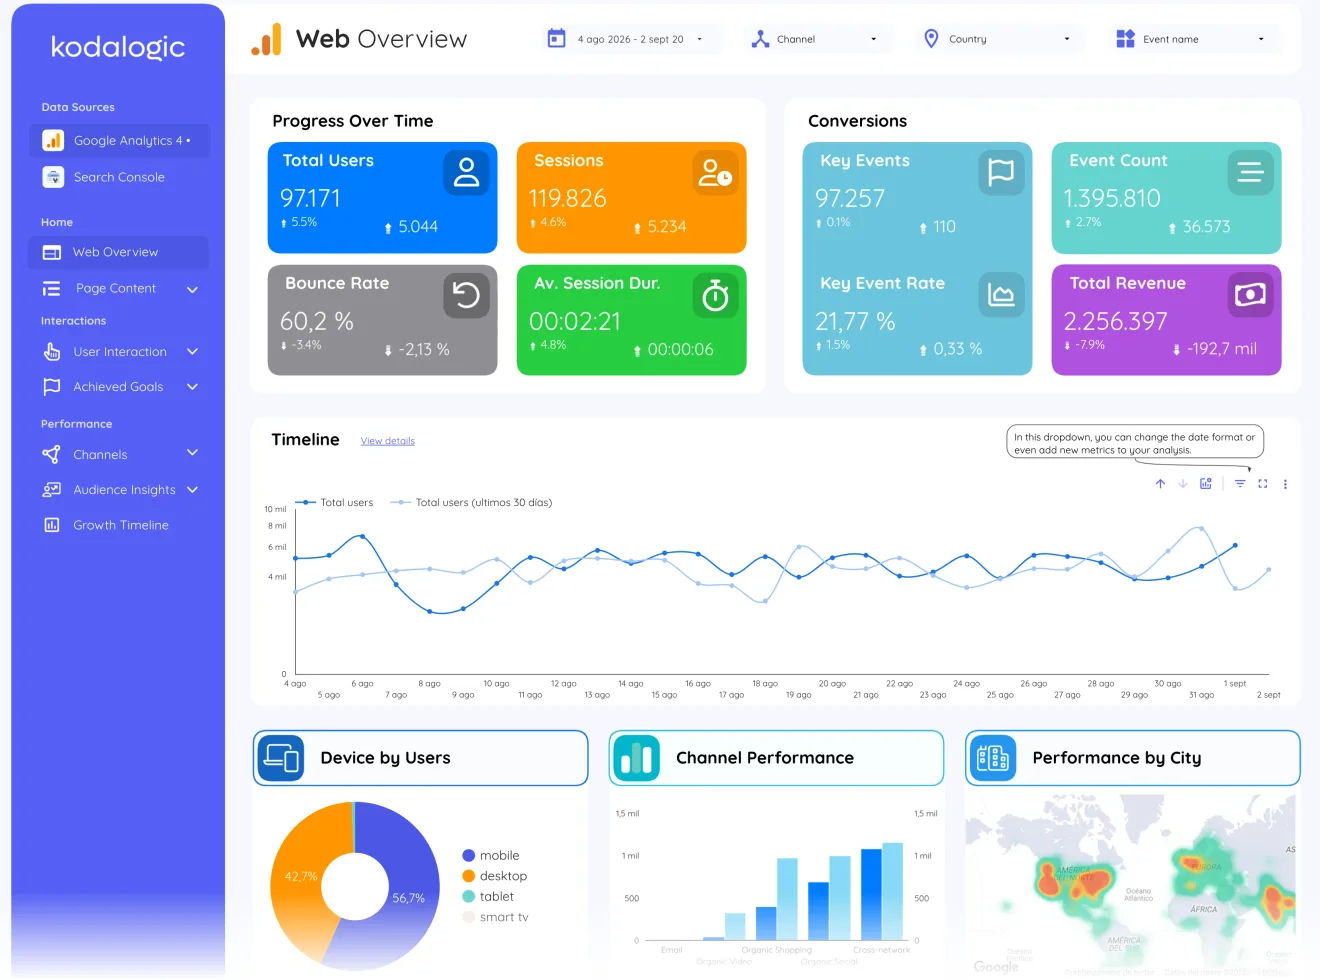
The eight headline numbers with their deltas and the device, channel and city splits underneath: the five-second answer to “is this working” that a client should get without scrolling.
Reads: Total Users · Sessions · Bounce Rate · Av. Session Dur. · Key Events
- Page 2 of 27
Page content
Every page ranked by views, sessions, bounce and key events with page-path search: where content strategy meets evidence.
Reads: Page Views · Pages / Session · Pages / User · Avg. Session Dur. · Views
- Page 3 of 27
Landing page
Entry points ranked by the traffic they attract and the behaviour that follows, plotted over time. The bridge between a ranking on the search side and an outcome on the traffic side.
Reads: Sessions · Views · Bounce rate · Key events · Landing page
- Page 7 of 27
Conversions
Every key event counted and trended, with its rate and the revenue attached, broken out by device, channel and location. The section a retainer conversation ends on.
Reads: Key Events · Event Count · Key Event Rate · Total Revenue · Event name
- Page 9 of 27
Channels
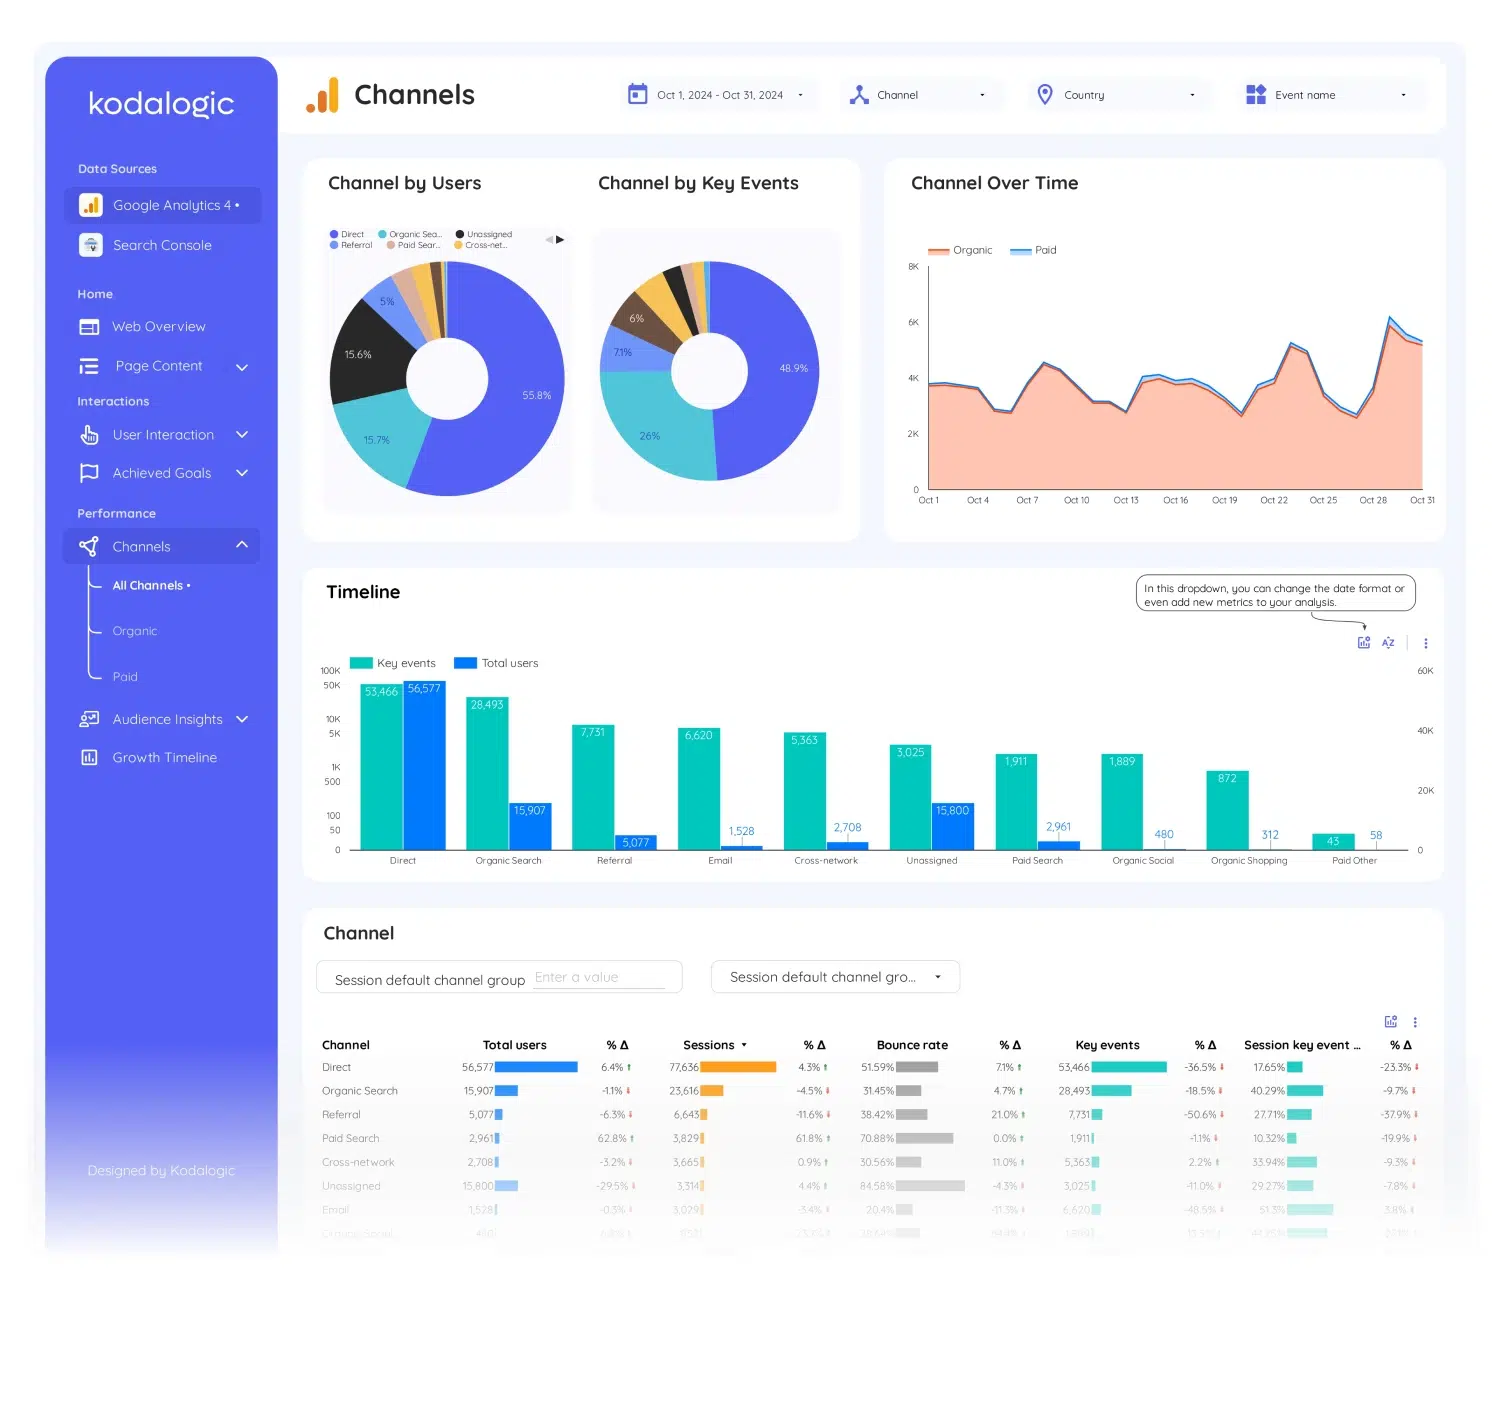
Direct, organic, paid, referral and social in one table with users, key events and revenue per channel, and the organic versus paid area chart an SEO report opens with.
Reads: Total users · Sessions · Bounce rate · Key events · Session key event rate
- Page 10 of 27
Organic
Organic pulled out of the channel mix and measured on its own terms, filterable down to a single page path. What the SEO work produced, separated from everything it shares the site with.
Reads: Total Users · Sessions · Bounce Rate · Av. Session Dur. · Key events
- Page 14 of 27
Growth timeline
Twelve months of the traffic side with the best day, week, month and quarter picked out automatically. The long view a renewal conversation opens with, before the search timeline seven pages later shows whether visibility moved first.
Reads: Sessions · Total users · Key Events · Bounce rate · Views
- Page 15 of 27
Search overview
Impressions, clicks, tracked keywords, site CTR and average position from Search Console: how Google sees the site, next to what visitors did about it.
Reads: Impressions · Clicks · Keywords count · Site CTR · Average Position
- Page 16 of 27
Brand vs generic
Branded queries split from generic demand, each with its own keywords, CTR and position and a written interpretation of the trend. If most organic traffic is branded, SEO is not doing what the aggregate suggests; this page keeps that honest.
Reads: Impressions · Clicks · Site CTR · Average Position · Brand Keywords
- Page 19 of 27
Keyword analysis
Every query with impressions, clicks, CTR and position, searchable and grouped by length: the working table where individual rankings get investigated.
Reads: Impressions · Clicks · Site CTR · Average Position · Short Tail
- Page 22 of 27
Page rankings
Keywords bucketed into top 3, 4 to 10, 11 to 20 and beyond with improved and declined lists: ranking progress made legible before traffic moves.
Reads: Top 3 · Top 10 · Top 20 · Rest · Average Position Last Quarter
- Page 27 of 27
Search growth timeline
Twelve months of the Search Console side: impressions and clicks over the long run, the visibility trend that pairs with the traffic timeline seven pages earlier.
Reads: Average Position · Impressions · Clicks · Site CTR · Queries
The sections an SEO report needs, and the questions each one answers
Visibility and rankings
Impressions, clicks, CTR and average position from Search Console, with period-over-period movement.
- Which pages earned their traffic, and which rank without clicks?
What the traffic did
Sessions, engagement and conversions from GA4 beside the search data that produced them.
- Did organic visibility translate into sessions and conversions this month?
Brand vs generic
The split that keeps awareness growth from hiding acquisition problems.
- Is acquisition improving once brand searches are set aside?
Written analysis
Smart Interpretations states what changed and what it suggests, in sentences, from the connected data.
- What should the client read first?
The template, in numbers
- Best for...
- For SEO teams focused on organic growth.
- Traffic Overview
- Includes GA4 data + search queries and clicks.
- Conversion Tracking
- GA4 conversions and search click data.
- Audience Insights
- Insights on user search behavior via GA4.
- Keyword Performance
- Organic search queries and rankings.
- Search Engine Optimization
- In-depth SEO analysis using GA4 data.
- Acquisition Channels
- Organic traffic and search engine breakdown.
- Geographic Data
- Regional insights and search query breakdown.
- User Engagement Metrics
- GA4 metrics + search engagement (CTR).
- Setup Time
- Easy configuration: 2-3 minutes.
Which template to buy for an SEO report
Built for this report
Web & SEO Dashboard for Data Studio — GA4 + Search Console
See why your traffic converts or does not. GA4 and Search Console unified — with Smart Interpretations writing the analysis automatically.
$214
One-time payment, lifetime updates, unlimited copiesWhen another one fits better
When the report is about rankings only and needs the deeper keyword pages: search intent, clusters, short and long tail.
When Google Ads also runs and the client wants organic and paid on the same link.
- Compare all six side by side
What buyers say about working with kodalogic
- ★★★★★
carrieloranger, United States of AmericaHe was very knowledgeable with Data Studio/Looker and helped me so much. When it was time to make changes, he was very responsive and accommodating. He is a happy and hard-working person and I can tell that he enjoys his work and helping his clients very much. I would say he went above and beyond in terms of being responsive and accommodating to all of the requested edits. I will definitely use him again and highly recommend him to anyone who needs expertise with reporting dashboards.
- ★★★★★
aamirmursleen, PakistanI had a great experience with him. He helped me make a report using Google Looker Studio, with data from Facebook Ads and Google Ads. He knew a lot about these and made a really good report. I asked for many changes, and he did all of them without any problems. He was very patient and made sure I was happy with everything. I'm 100% satisfied with his work. He's the best!
- ★★★★★
phoebelai2024, AustraliaKodalogic are exceptional professionals in data visualization! Their attention to detail and ability to exceed expectations truly stand out. Working with them was a pleasure thanks to their politeness, proactive communication, and quick responsiveness. We’ve worked with them three times and will definitely recommend them to anyone needing GA reporting support. 👍
All 100 reviews, with the country and date of each one.
Read the deep dive
- What is an SEO reporting dashboard? →
The framework this report follows: which metrics belong in a client-facing dashboard, which ones to leave out, and why the branded split changes the conversation.
- SEO insights with smart dashboards →
Why GA4 and Search Console are worth more together than apart, with the questions only the combination can answer.
- What is Smart Interpretations? →
The analysis layer that writes the takeaway under these charts, and what it flags on live data.
- Automated SEO reports with a Data Studio dashboard →
What automating this cycle is worth in hours per client, what genuinely automated reporting means beyond a scheduled PDF, and the six sections every report needs.
- Schedule the dashboard for email delivery →
How to have Looker Studio send this report by itself, weekly or monthly, with the live data of the moment it goes out.
- Put your client logo and colors on the report →
The three-click white-label pass: duplicate the base report, swap the data source, drop in the client brand.
- Best Looker Studio templates for 2026 →
The full comparison of the six dashboards we build, what each one covers and which situation each one fits.
How it connects
Both sources connect with Google's native connectors: you authorise your Search Console property and your GA4 property once, inside your own Data Studio copy. From then on the report refreshes itself: the same link serves the monthly client email and the quick mid-month check, with no export step in between.
Setup guides that apply
- Connect GA4, Search Console or Google Ads to your Data Studio template · Connect your Google Analytics 4, Google Search Console or Google Ads data to your copy of the Data Studio template in minutes, with Google’s native connectors and no third-party service.
- Share a Data Studio report with clients and schedule email delivery · Share your Data Studio report template with clients through a live viewer link, or schedule a PDF snapshot by email every week or month; both are built into Data Studio.
- Share Data Studio report access with another email · How to give a client or colleague viewer access to your Data Studio report template from another Google account, and what to do when they still cannot see the data.
The team agencies hire to build their dashboards
Six dashboards, one team, one design system.
- 4.97 / 5
across 100 verified reviews, 94 of them five stars, from clients in 27 countries who hired us to build their Looker Studio dashboards
Read every review - 85 fields
documented across Google Search Console, Google Analytics 4 and Google Ads, one definition each, so you know what every number in the report means
Open the Google Analytics 4 reference - Lifetime
updates and a setup guide with every dashboard, from the same team that built it
Docs, delivery and setup - 329,000+
reads on our Looker Studio guides, written by the people who build the dashboards
Read the guides
Before you ask
- What sources does it connect?
- Google Search Console and Google Analytics 4: both native Data Studio connectors, using your own accounts.
- Can I send it to clients monthly?
- Yes: the shared link always shows current data, and Data Studio can email a scheduled snapshot.
- How long does the setup take?
- Two authorisations: your Search Console property and your GA4 property, inside your copy of the report. Most buyers have the first report live within the hour, before customising colours or logo.
- Can I add my own pages to it?
- Yes. Your copy is a normal Data Studio report: add a page, drop in a chart, change a metric. The setup guide shows where each source is configured so the new page reads the right one.
- What does the client receive each month?
- Whatever you choose: the same link, always current, or a scheduled PDF snapshot that Data Studio emails on the day and hour you set.
The terms this report uses
- SEO report
An SEO report is a periodic summary of a site’s organic search performance: how visible it was, which queries and pages earned that visibility, and how both changed against the previous period.
- SEO performance
SEO performance is how well a website earns visibility and visits from organic search, measured as a chain rather than a single number: impressions, clicks, click-through rate and average position in Search Console, and the sessions and conversions those clicks produce in Google Analytics 4.
- Impressions
An impression is counted each time a link to a site appears in a search results page a user views, whether or not it is clicked.
- CTR (click-through rate)
CTR is clicks divided by impressions, expressed as a percentage: the share of times a listing was shown that ended in a click.
- Sessions
A session is a group of interactions one user has with a website within a period of time; in Google Analytics 4 it starts with a session_start event and ends after 30 minutes of inactivity.
- Engagement rate
Engagement rate is the percentage of sessions that were engaged sessions in Google Analytics 4: sessions that lasted longer than 10 seconds, produced a key event, or included at least two page or screen views.
- Key events
Key events are the events in Google Analytics 4 that you mark as the ones that matter to the business: a purchase, a lead form, a sign-up, a call.
SEO Report, built. Yours the same afternoon.
Copy the template into your own Data Studio, connect your property, put your brand on it. The report your client opens on Monday is the one you saw in the demo today.
$214
One-time payment. No taxes charged.
94 of 100 buyers gave it five stars, from 27 countries. Every review, with its date.