Google Analytics 4 · Metric
What is Engagement rate?
Engagement rate is the percentage of sessions that were engaged sessions in Google Analytics 4: sessions that lasted longer than 10 seconds, produced a key event, or included at least two page or screen views.
7,530 engaged out of 11,960 sessions: an engagement rate of 63%.
- Data source
- Google Analytics 4
- Type
- Metric
- API field
- engagementRate
- Formula
- Engagement rate = engaged sessions / sessions × 100
Why it matters
It replaced bounce rate as the primary quality metric in GA4; bounce rate still exists and is simply its inverse (100% minus engagement rate). A session with one page view that lasted 40 seconds counts as engaged, which bounce rate in Universal Analytics never allowed.
How to read it
The 10-second threshold can be raised up to 60 seconds in the data stream settings, so two properties with different thresholds are not comparable. Engagement rate also depends on events firing, which means a site with poor tracking looks disengaged rather than broken.
In a Data Studio report
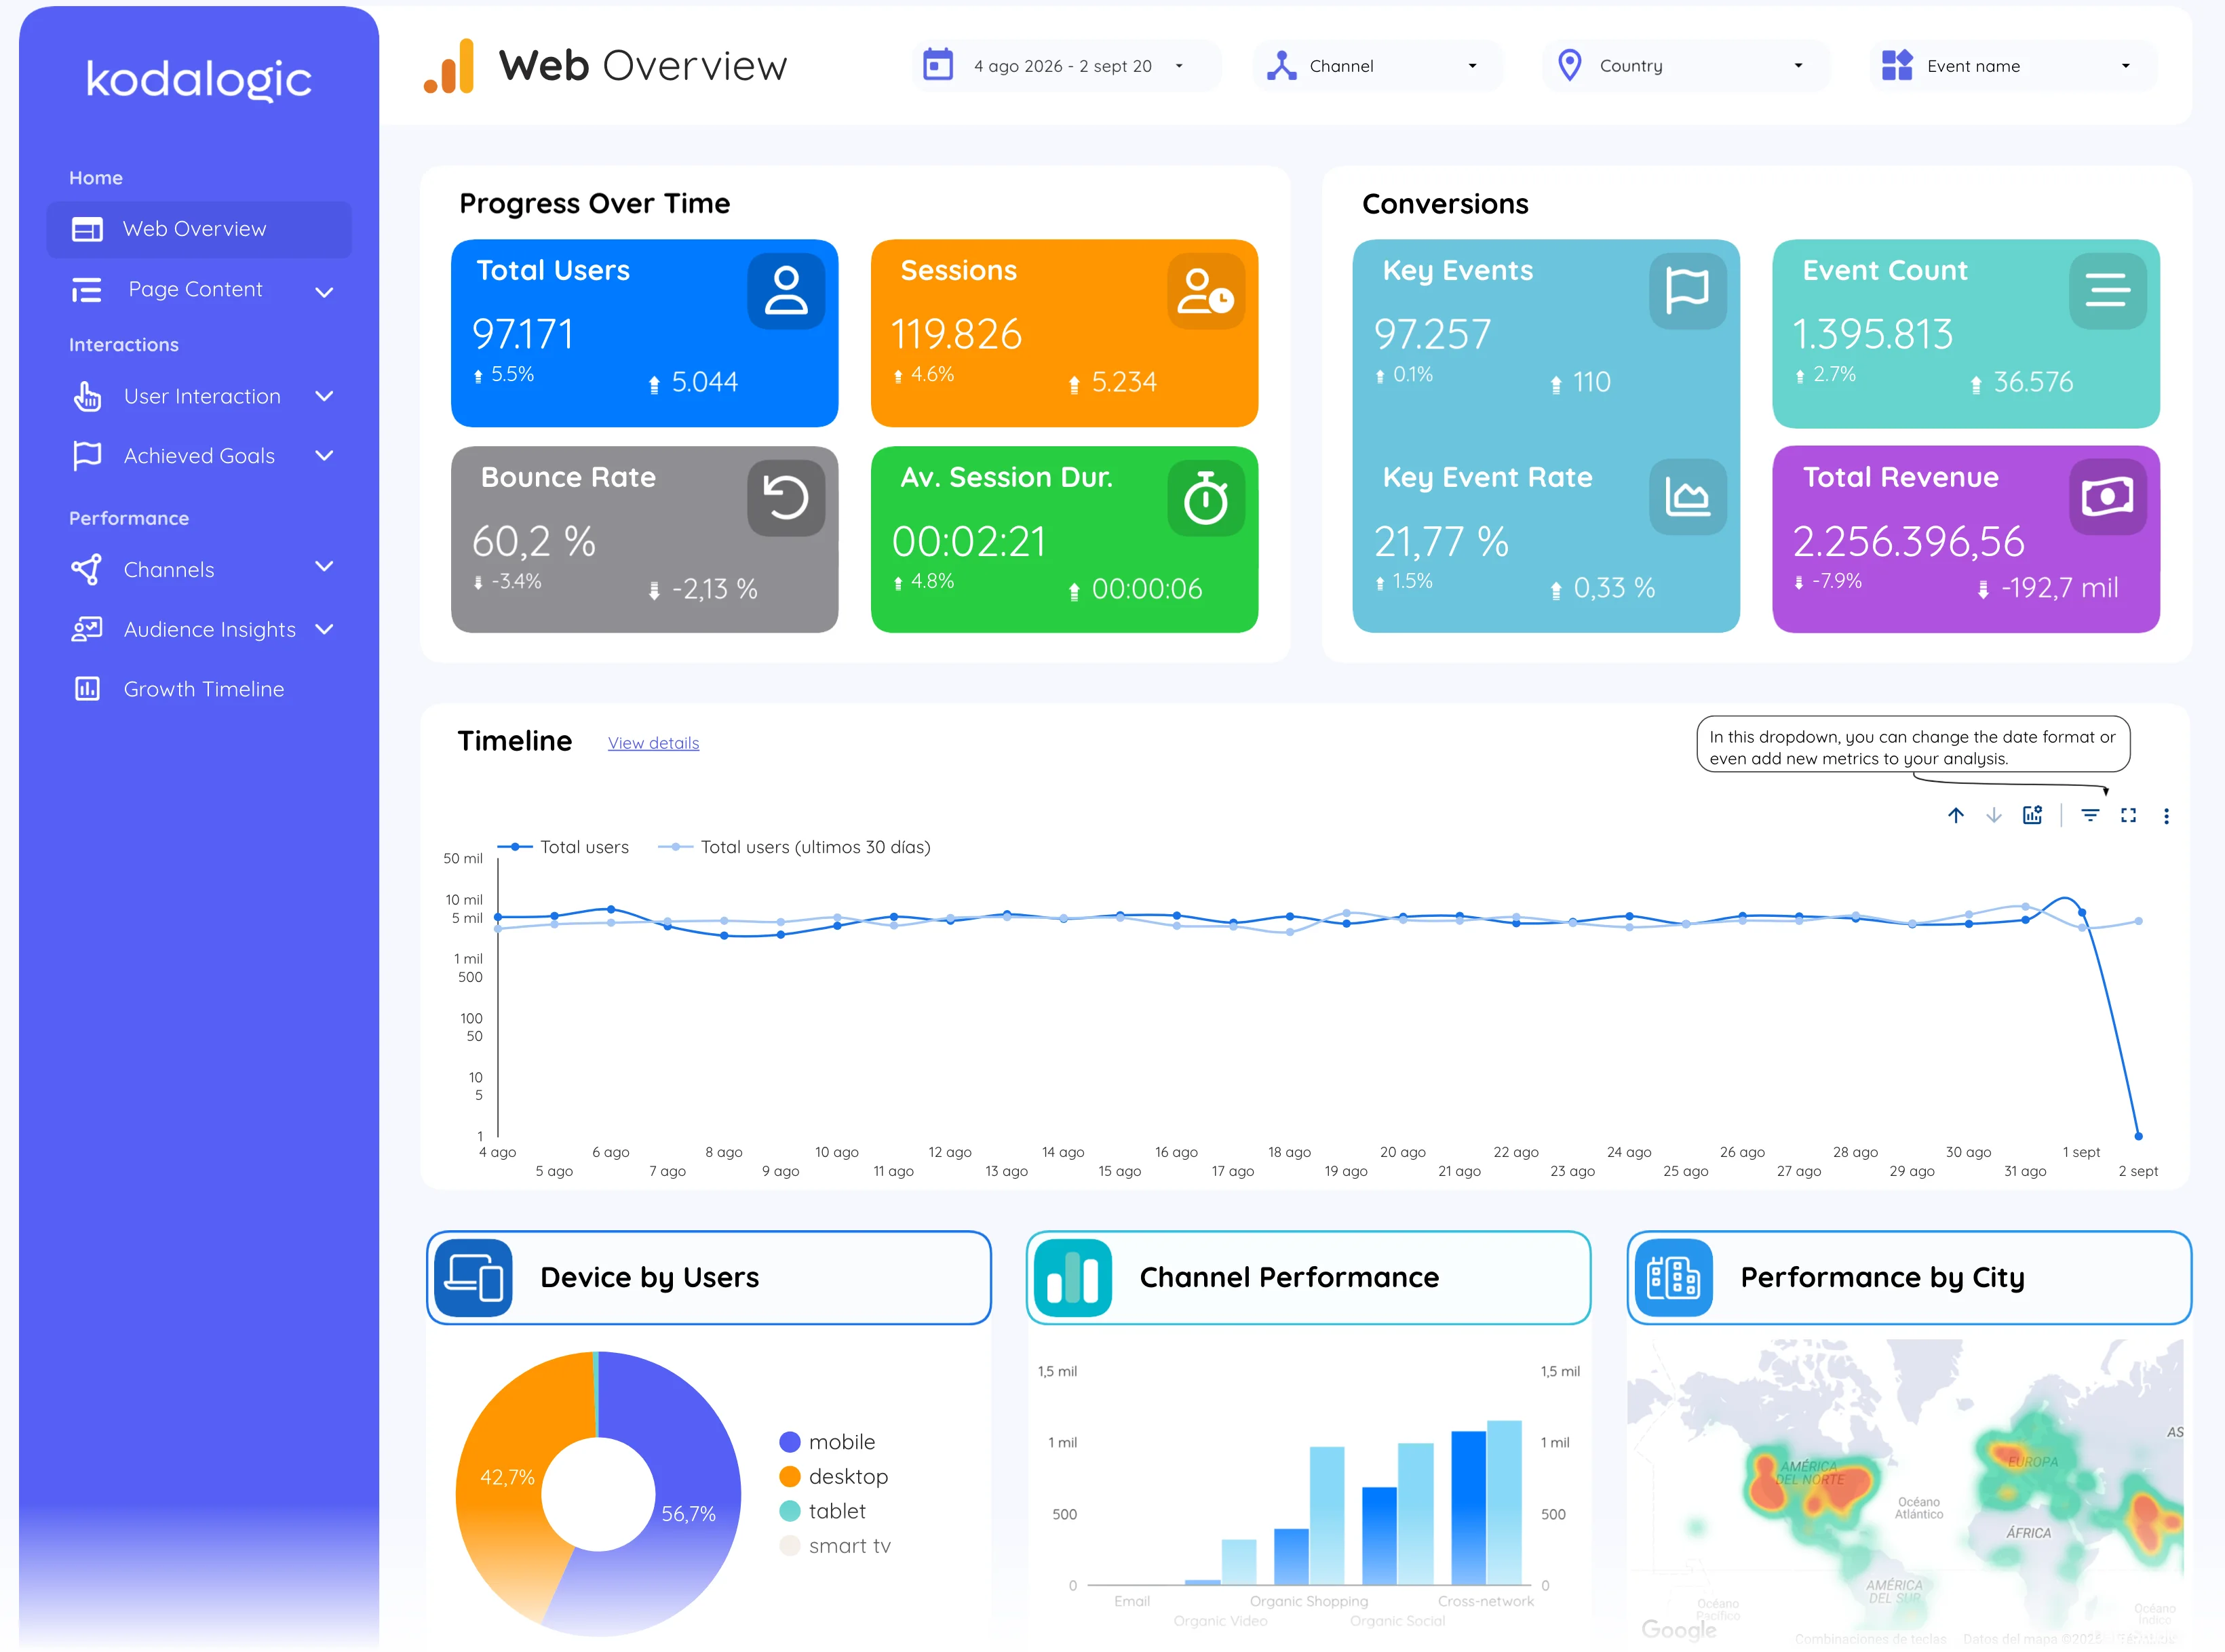
In a Data Studio (formerly Looker Studio) report engagement rate is a headline scorecard and a column in every channel, landing page and country table. The most useful chart pairs it with sessions: high traffic with low engagement points at the wrong audience, low traffic with high engagement at a page worth promoting.
Where to find it in Google Analytics 4
Google Analytics 4: Reports, then Acquisition, then Traffic acquisition (the Engagement rate column); the threshold under Admin, then Data streams, then Adjust session timeout.