Google Analytics 4 · Metric
What is Average engagement time?
Average engagement time is the mean time a website was in the foreground of a visitor's browser, per active user, during the selected period in Google Analytics 4. It counts only time the page was actually visible and focused, not time left open in a background tab.
Engagement time divided by active users: how long each person actually stayed.
- Data source
- Google Analytics 4
- Type
- Metric
- Formula
- Average engagement time = total engagement time / active users
Why it matters
It replaced the old time on page, which could not measure the last page of a visit and inflated everything else. Engagement time is collected as an event parameter every few seconds, so a single-page visit that was really read counts, and a tab opened and forgotten does not.
How to read it
Per active user is the default and is what the GA4 interface shows; per session is a different metric with a different denominator, and dashboards that mix the two will not reconcile. Like any average of time, it is pulled up by a few very long visits, so read it with engagement rate and against your own previous period rather than against a benchmark.
In a Data Studio report
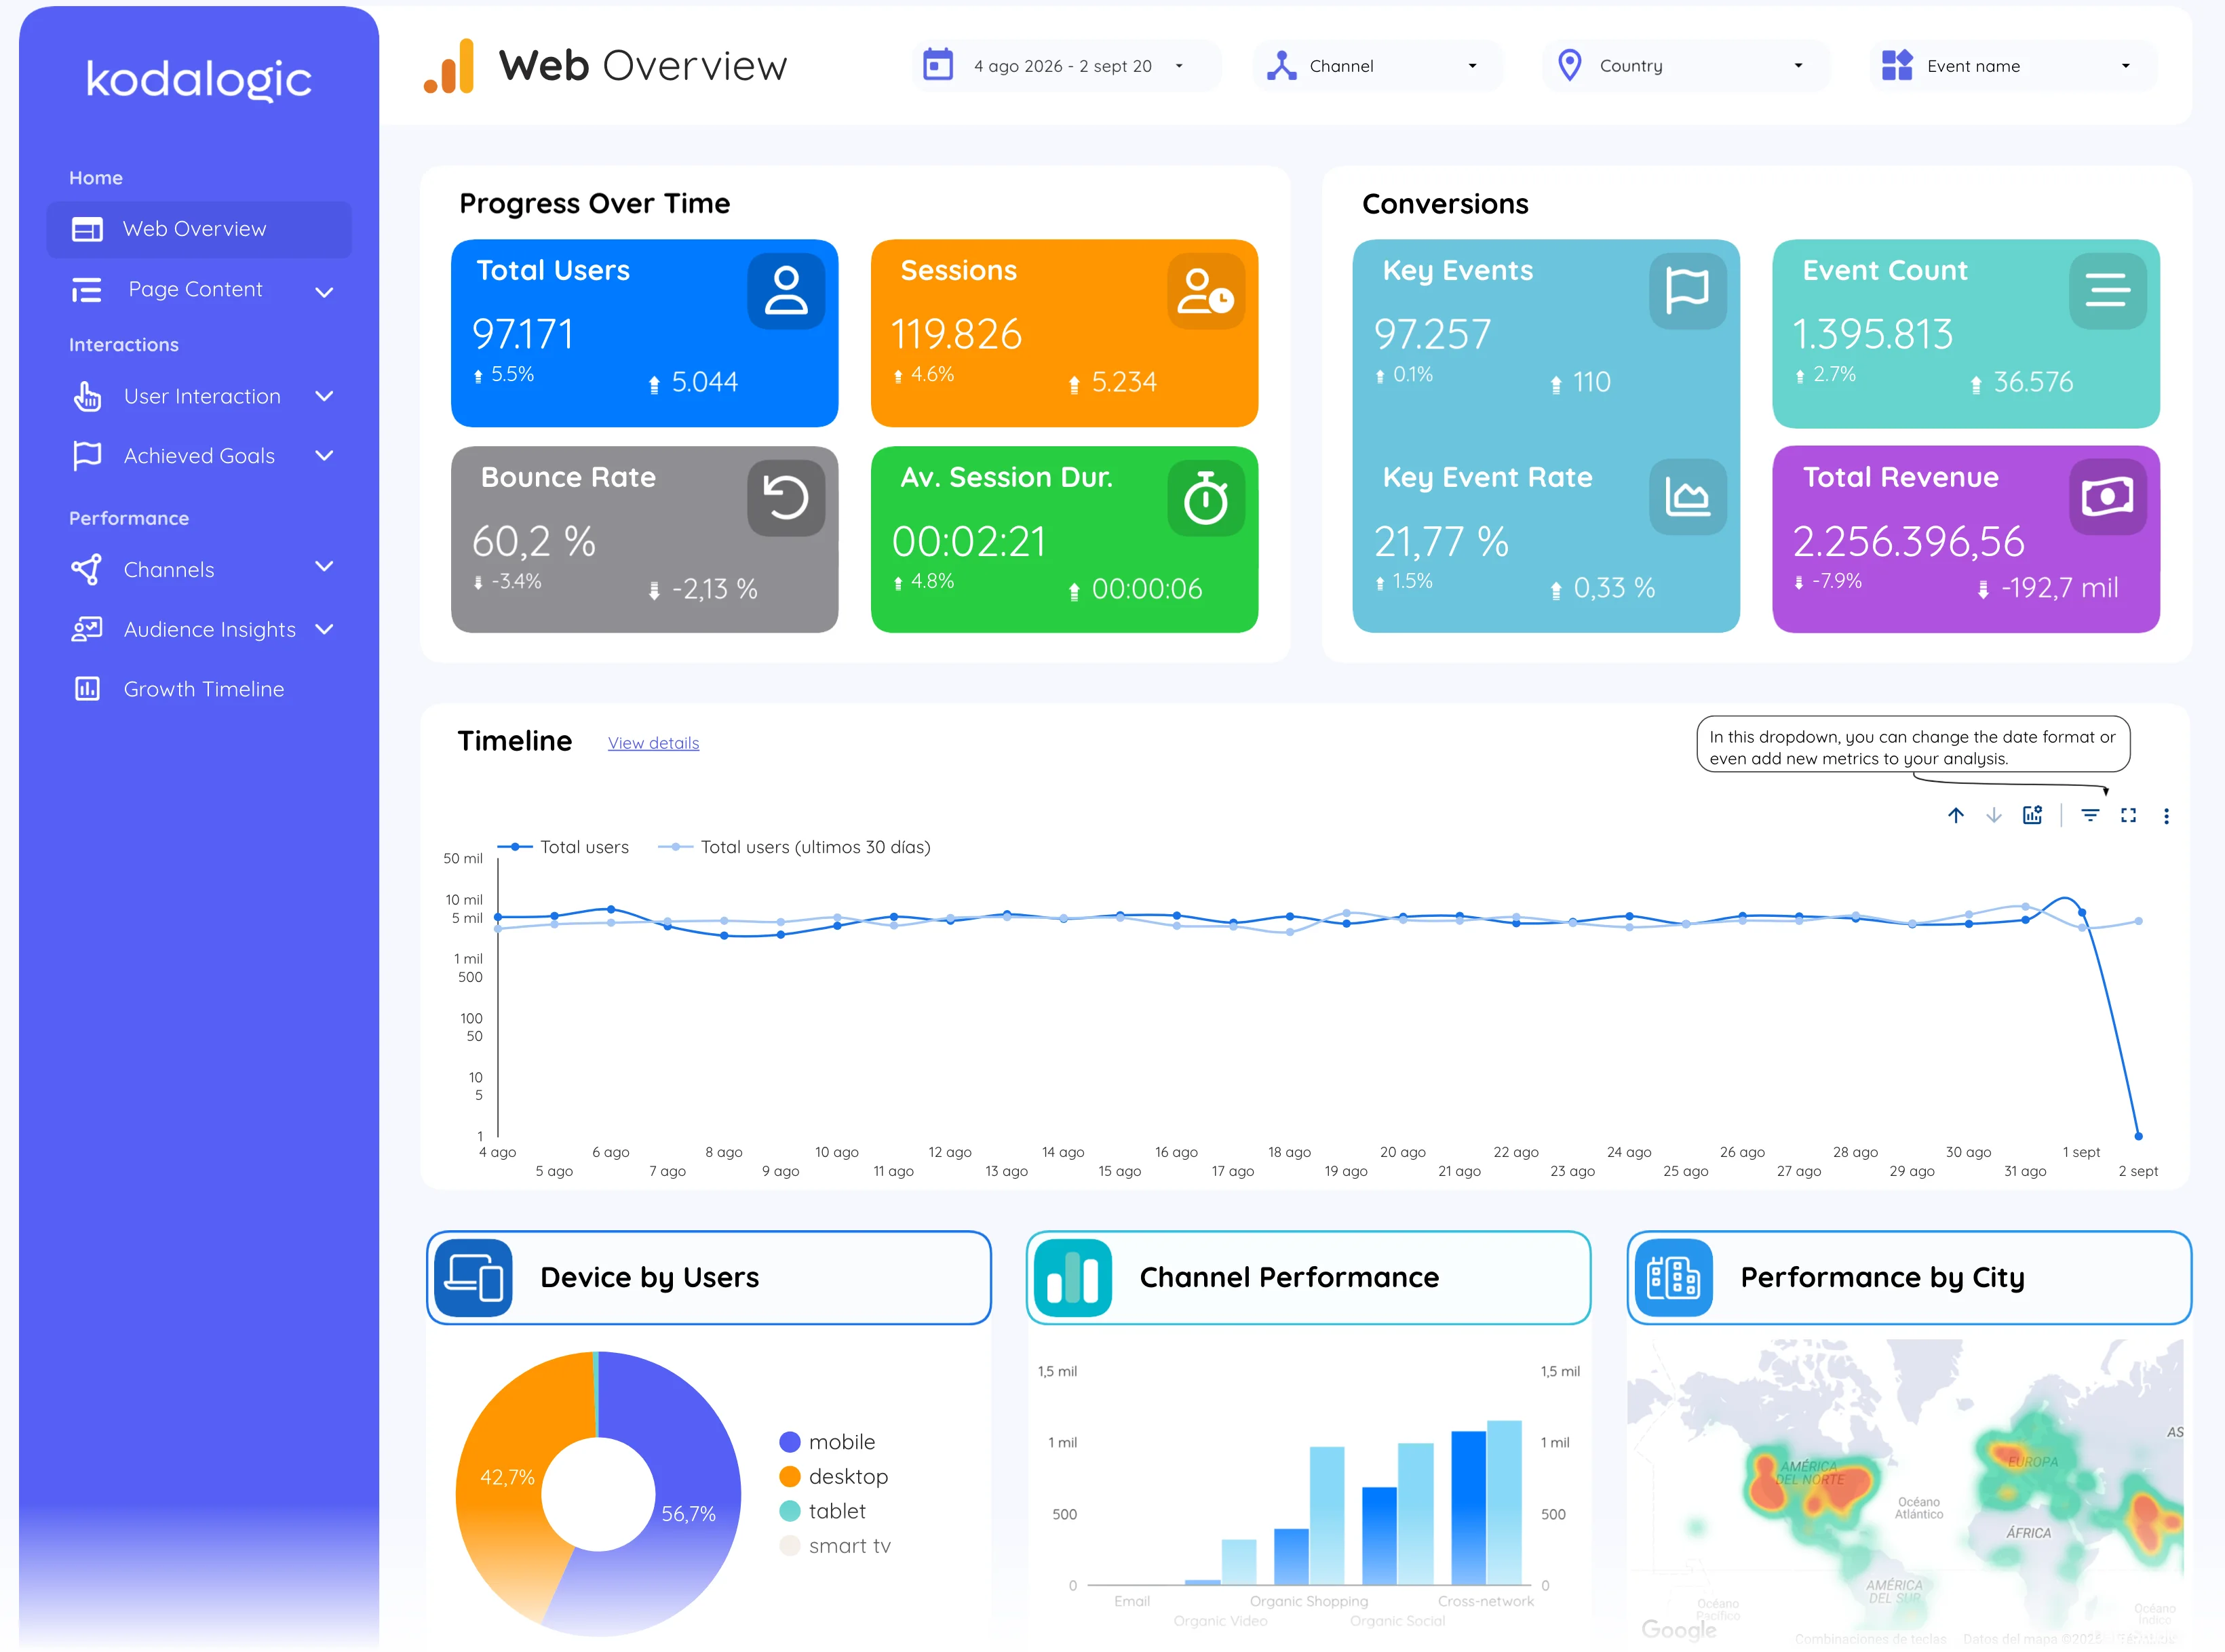
In a Data Studio (formerly Looker Studio) report it is a scorecard on the engagement page next to engagement rate and average session duration, and a column in the landing page and content tables, where it separates the pages people read from the pages they only open.
Where to find it in Google Analytics 4
Google Analytics 4: Reports, then Engagement, then Overview (the first scorecard); per page under Engagement, then Pages and screens.